
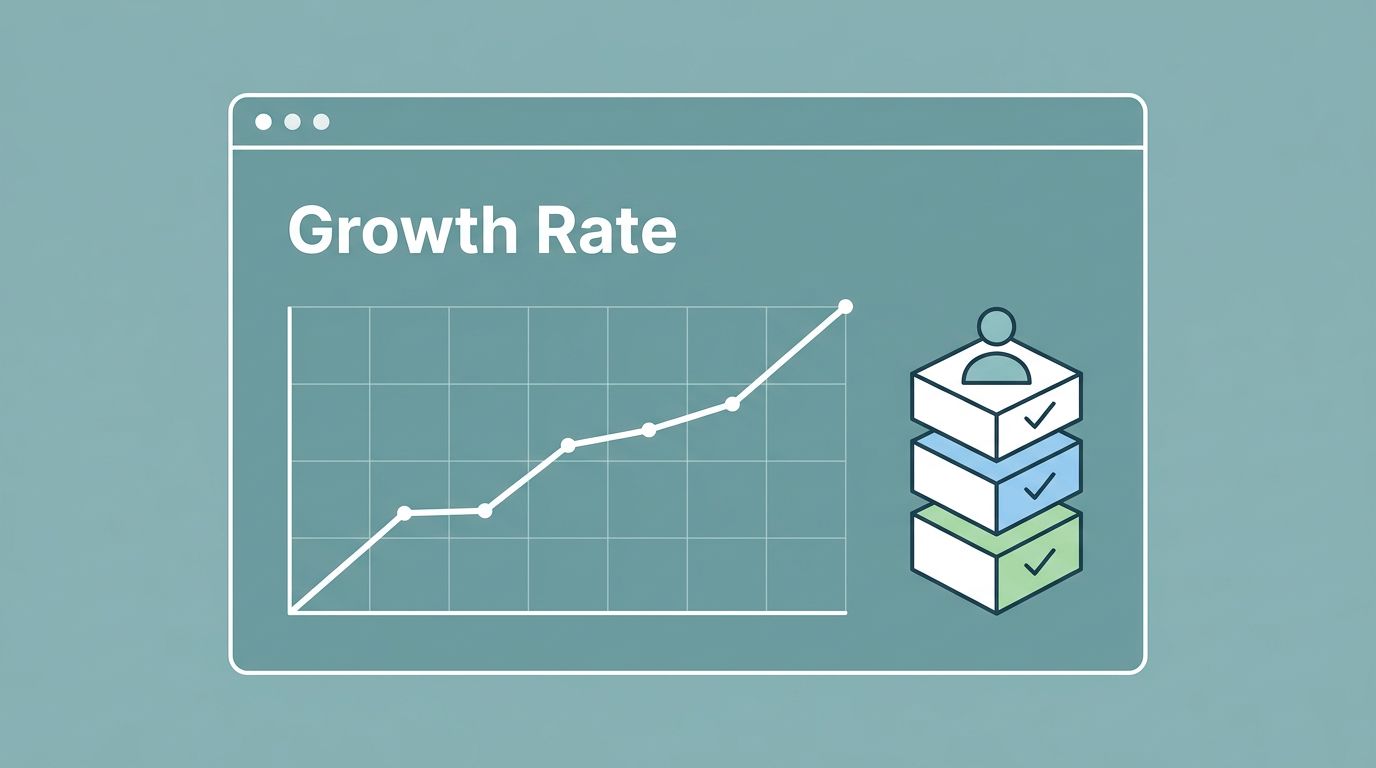


I can learn a lot from one number, but only if I calculate it the same way every month. When I track Baremetrics subscription growth rate, I’m watching whether my subscriber base is growing faster than it leaks. That matters because a busy acquisition month can hide weak retention. I want a number that tells
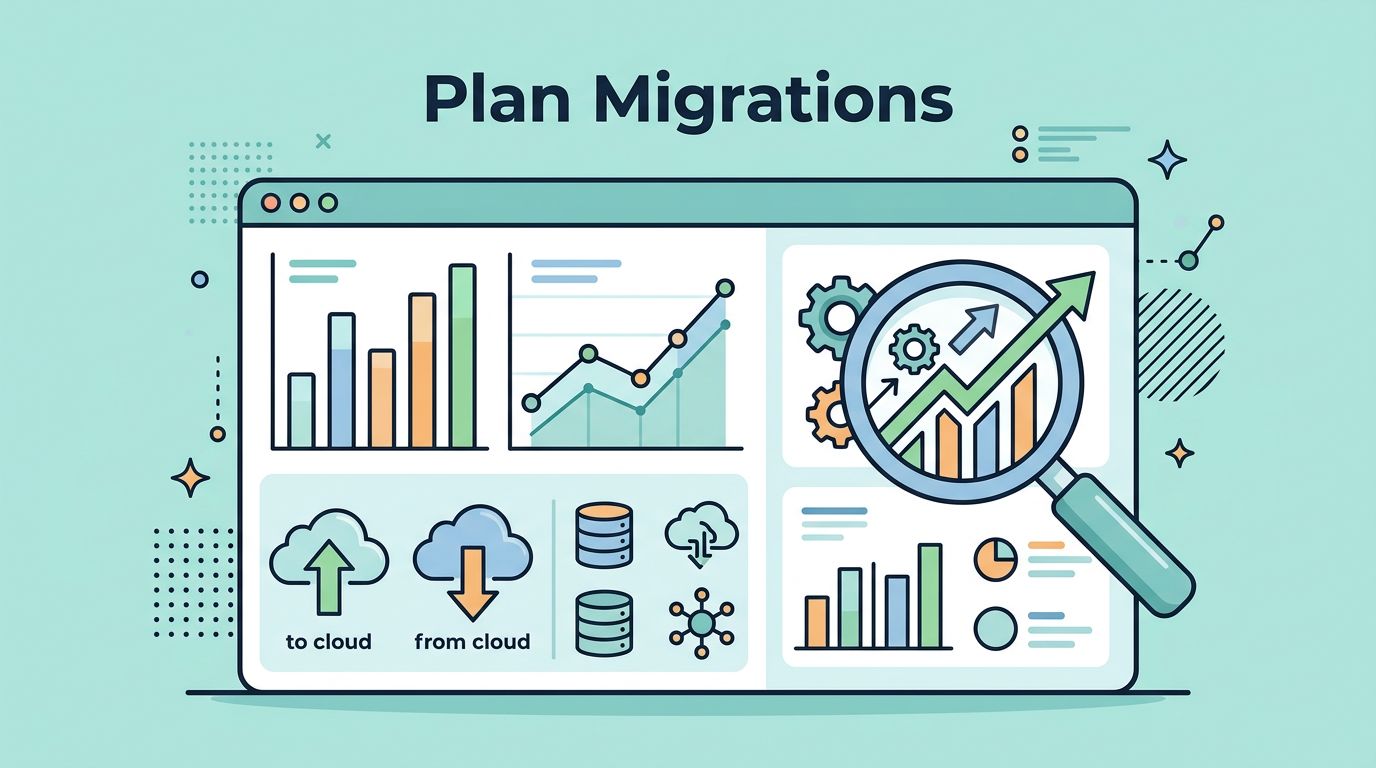
A plan change can hide in plain sight. One customer upgrades, another downgrades, and a third moves to a different tier, yet the real story is buried unless I watch it closely. That story matters because plan migrations shape expansion revenue, contraction, and churn risk. They also show whether pricing, packaging, and usage limits are

When I run a discount campaign, I want more than a redemption count. I want to know whether the coupon pulled in durable revenue or just shaved money off the top. That is where Baremetrics coupon tracking matters, because it helps me read the real cost of a discount, not just the fact that someone
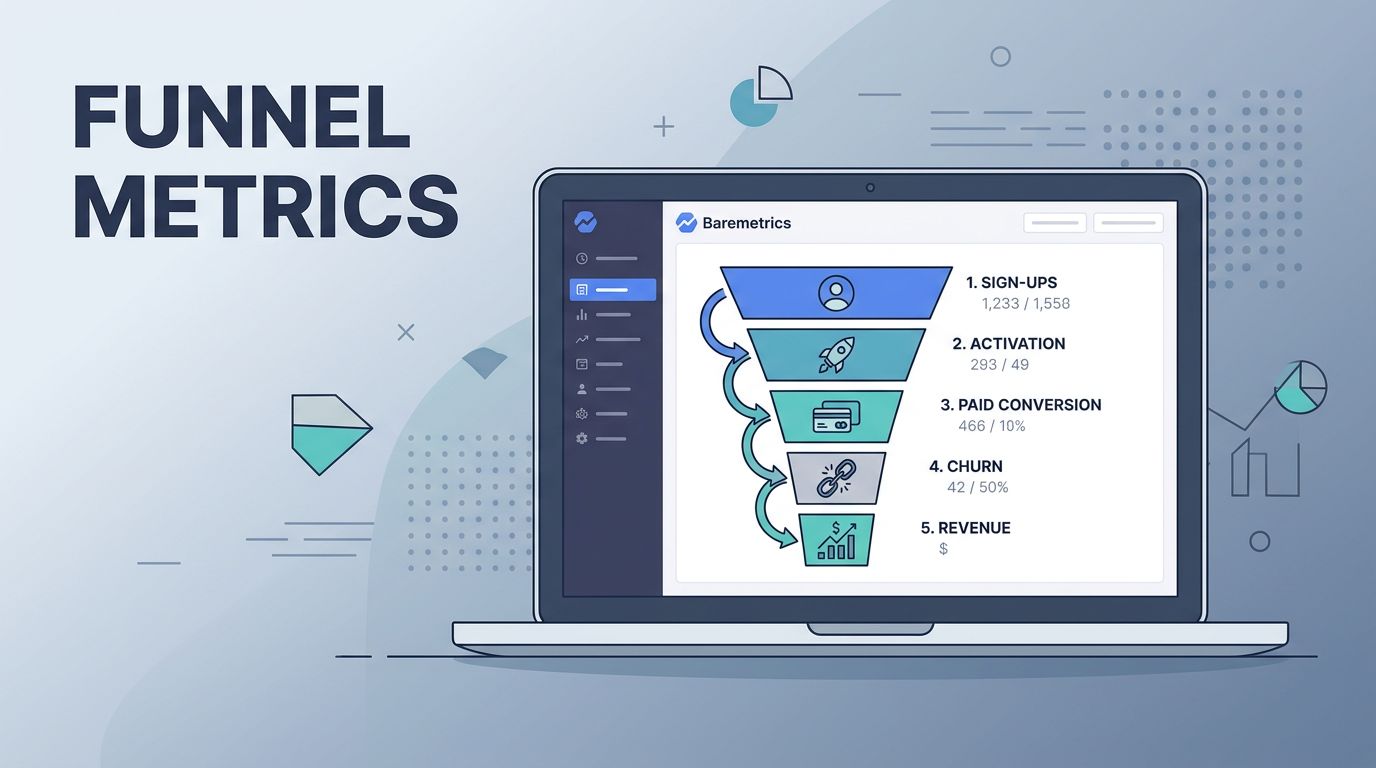
A SaaS funnel can look healthy while money slips out the side. When I open Baremetrics, I want to see where signups stall, where paid conversion weakens, and which cohorts turn into revenue instead of churn. That means I treat Baremetrics funnel metrics as a diagnostic tool, not a scoreboard. I use them to connect
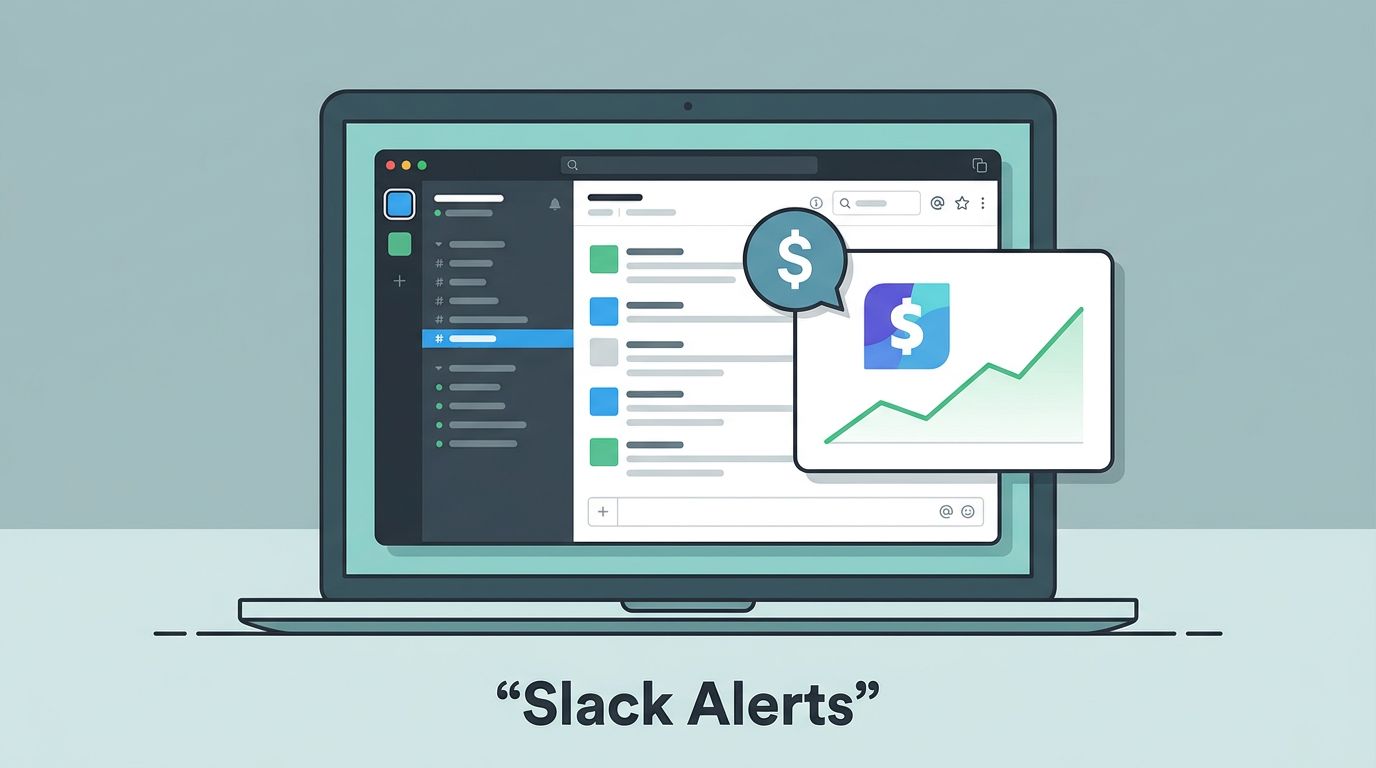
Payment problems rarely wait for a convenient moment. One failed charge can sit unnoticed long enough to create churn, extra support work, and awkward internal follow-ups. I use Baremetrics Slack alerts to bring payment events into one place I already watch. That keeps finance, product, and revenue teams close to the action while the details

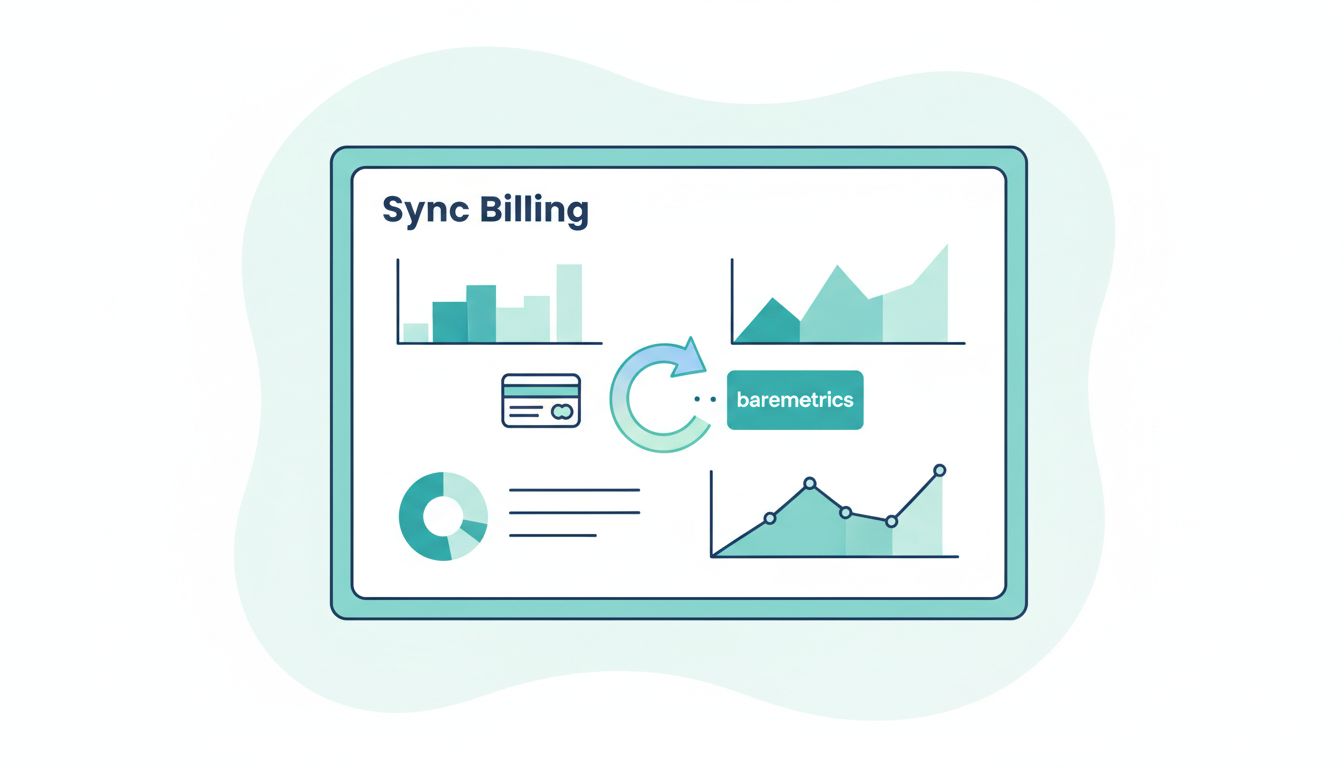
When my recurring revenue numbers feel off, I do not blame the dashboard first. I check the billing sync, because Baremetrics recurring billing reports are only as strong as the data behind them. Once the sync is clean, I can trust MRR, churn, LTV, and failed-payment reports without second-guessing every chart. I can also spot

I use Baremetrics email reports as a daily pulse, not a decorative inbox extra. When subscription revenue can shift from one billing event to the next, a clean report beats five dashboard tabs and a dozen half-finished Slack threads. The trick is simple. I keep the report short, I choose a cadence with a purpose,
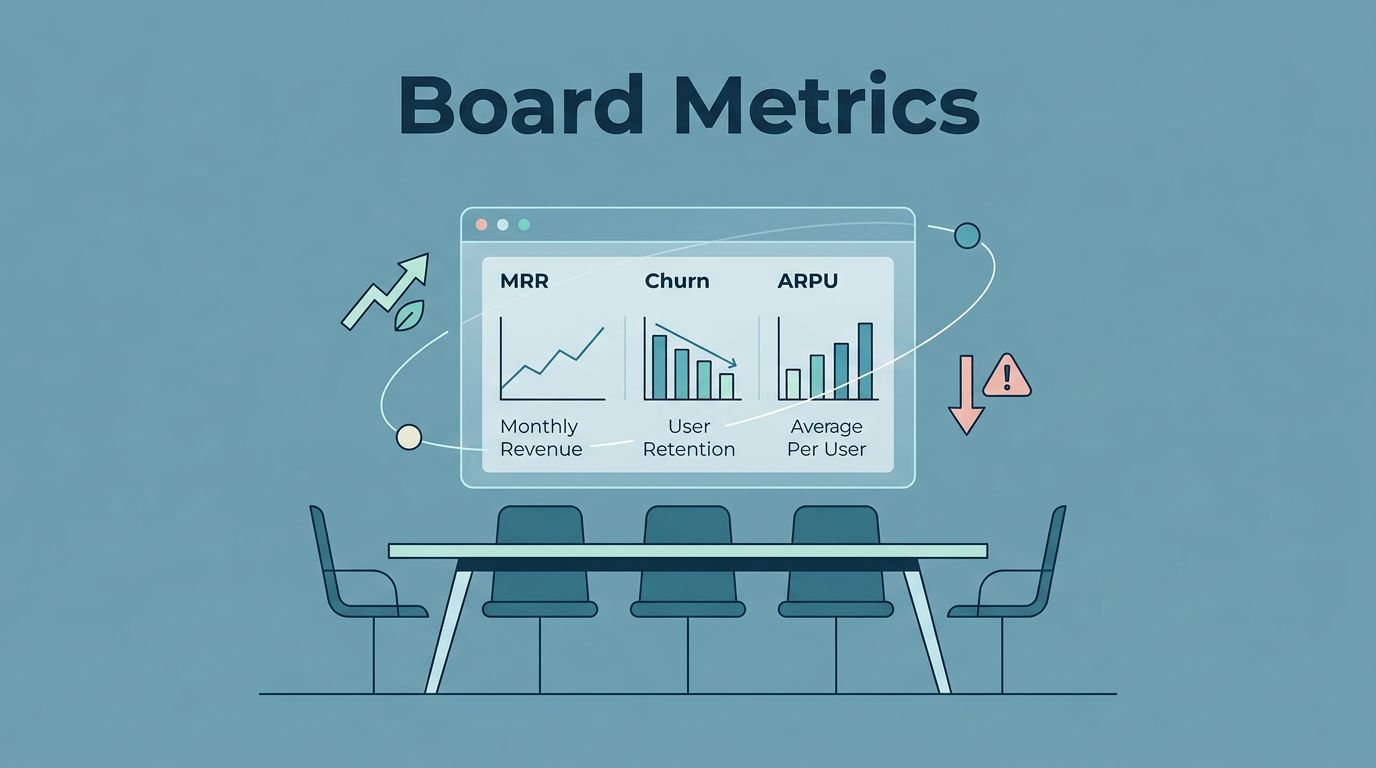
Board slides fall apart when the numbers arrive late, shift shape, or mean something different every month. I use Baremetrics to pull the revenue story into one place, then I turn that export into a board pack that I can explain without sweating through the meeting. The trick is simple. I keep the metric set
App store dashboards can show a spike, but they often hide the bill. I can see downloads, trials, renewals, and cancellations inside native tools, yet I still miss the full revenue story when billing moves across plans, regions, or channels. That is why I treat Baremetrics as an app store analytics alternative when the question

