


Refunds can make a strong sales month look thinner than the month felt. A monthly check of your Stripe refund rate shows the damage early, like checking the waterline on a boat before a small leak grows. The process takes about ten minutes once you set the routine. This guide covers two refund rate formulas,

A SaaS dashboard turns into a junk drawer fast. A useful Baremetrics dashboard answers one question in under a minute. Is recurring revenue getting stronger, weaker, or quietly leaking? B2B teams need signals they can trust and enough context to act. This guide shows how to build a focused Baremetrics dashboard for a B2B SaaS

Subscription revenue can look calm while small leaks spread under the floorboards. New customers may lift monthly recurring revenue (MRR) while existing customers cancel or downgrade. Baremetrics metrics help separate these movements so you can see whether growth rests on a healthy customer base. This guide covers the churn math, the Baremetrics views worth checking,

Cash and revenue rarely arrive together. A customer can pay for a full year today, and the business still earns the money month by month. SaaS revenue recognition is the set of rules for deciding when subscription cash counts as earned revenue. Upgrades, proration, churn, and contract edits turn a clean invoice into a muddy

Failed payments drain revenue in silence. A card expires, a bank blocks a charge, or a limit blocks a renewal, and a healthy subscription starts to wobble. Baremetrics dunning emails give subscription teams a structured way to win these customers back. This guide covers how Baremetrics Recover works, which billing platforms are supported, how retries
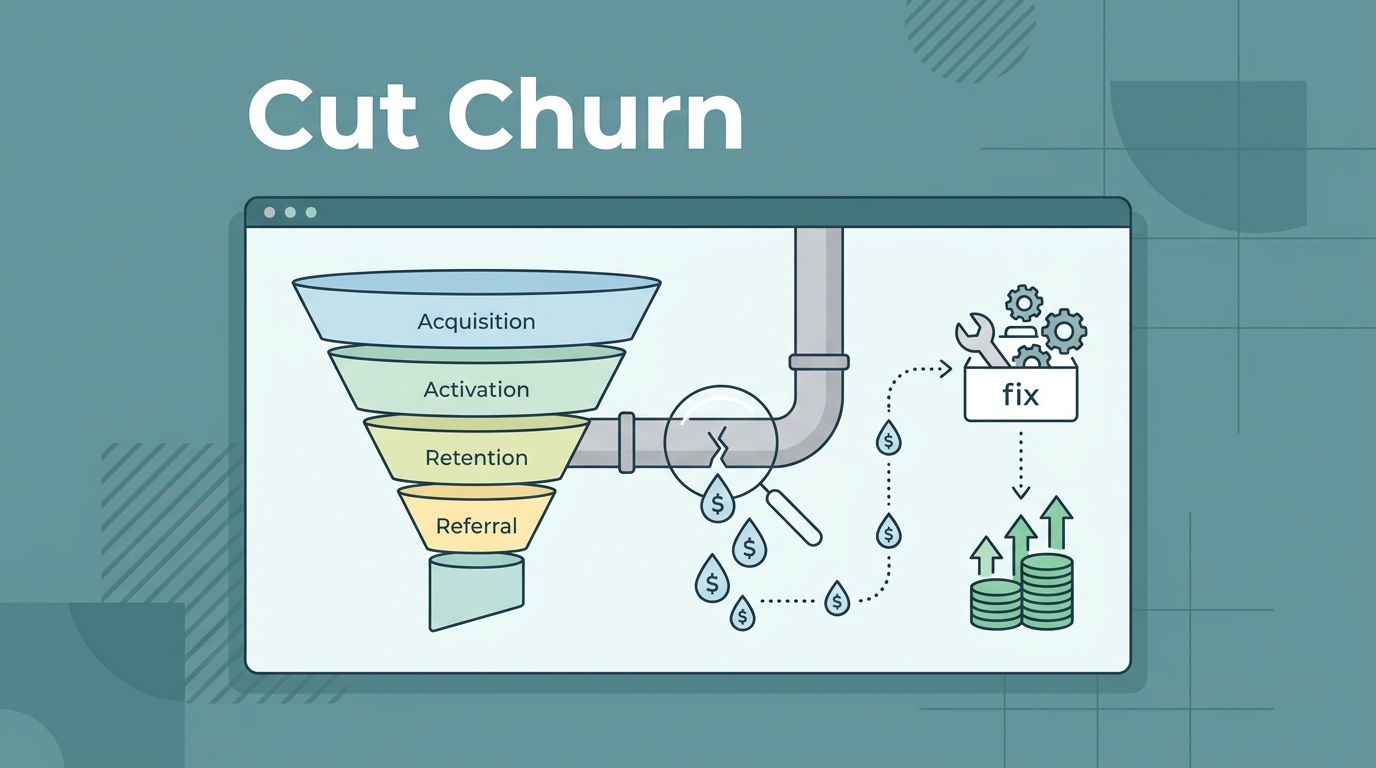
A churn chart shows a leak. Baremetrics Cancellation Insights shows where the pipe cracked. The add-on collects a reason from each cancelling customer and ties the reason to the revenue lost. This guide explains how the tool collects reasons, what the official pages say about price and setup, how to read the reports, and how

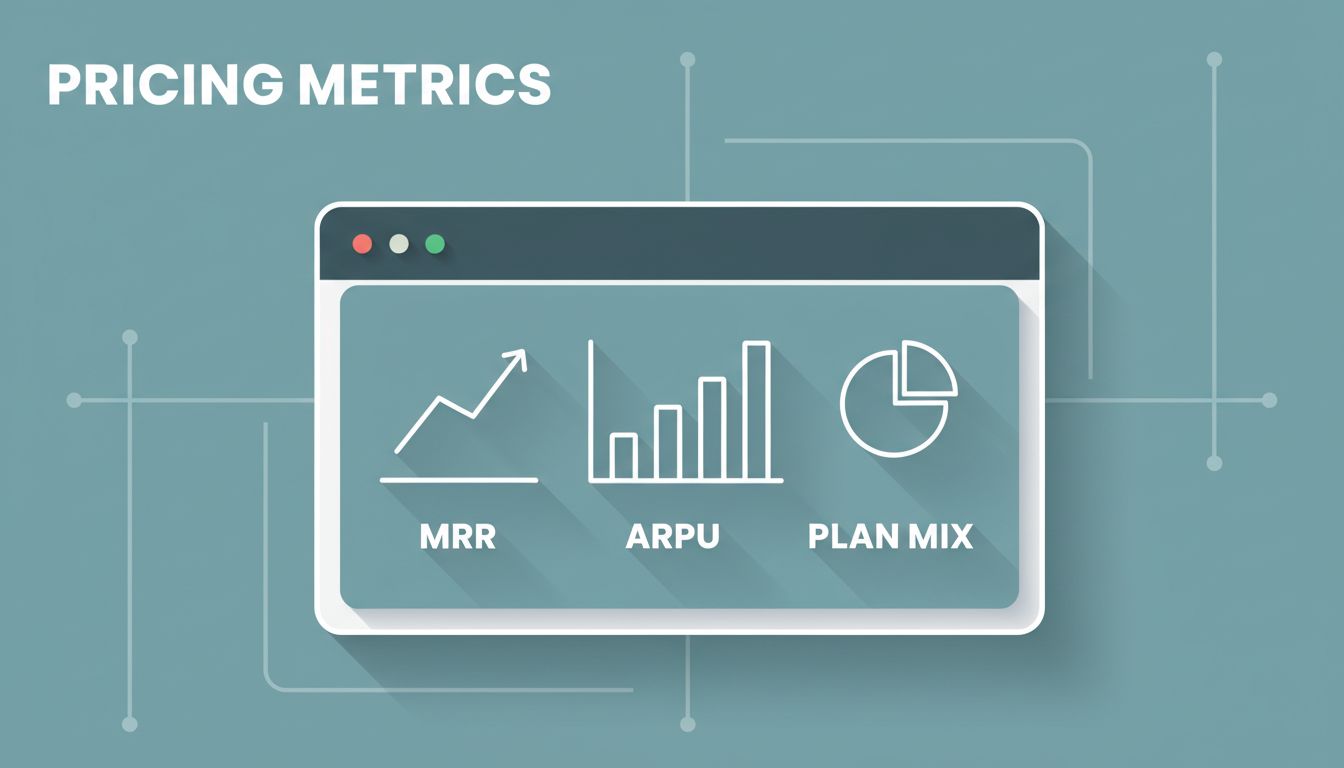
Pricing problems rarely announce themselves. They show up as flat ARPU, a growing pile of downgrades, or discounts eating margin. Baremetrics pricing metrics give a way to spot each pattern before revenue suffers. This guide shows which Baremetrics metrics inform pricing decisions, how the formulas work, how to compare them, and which signals point to
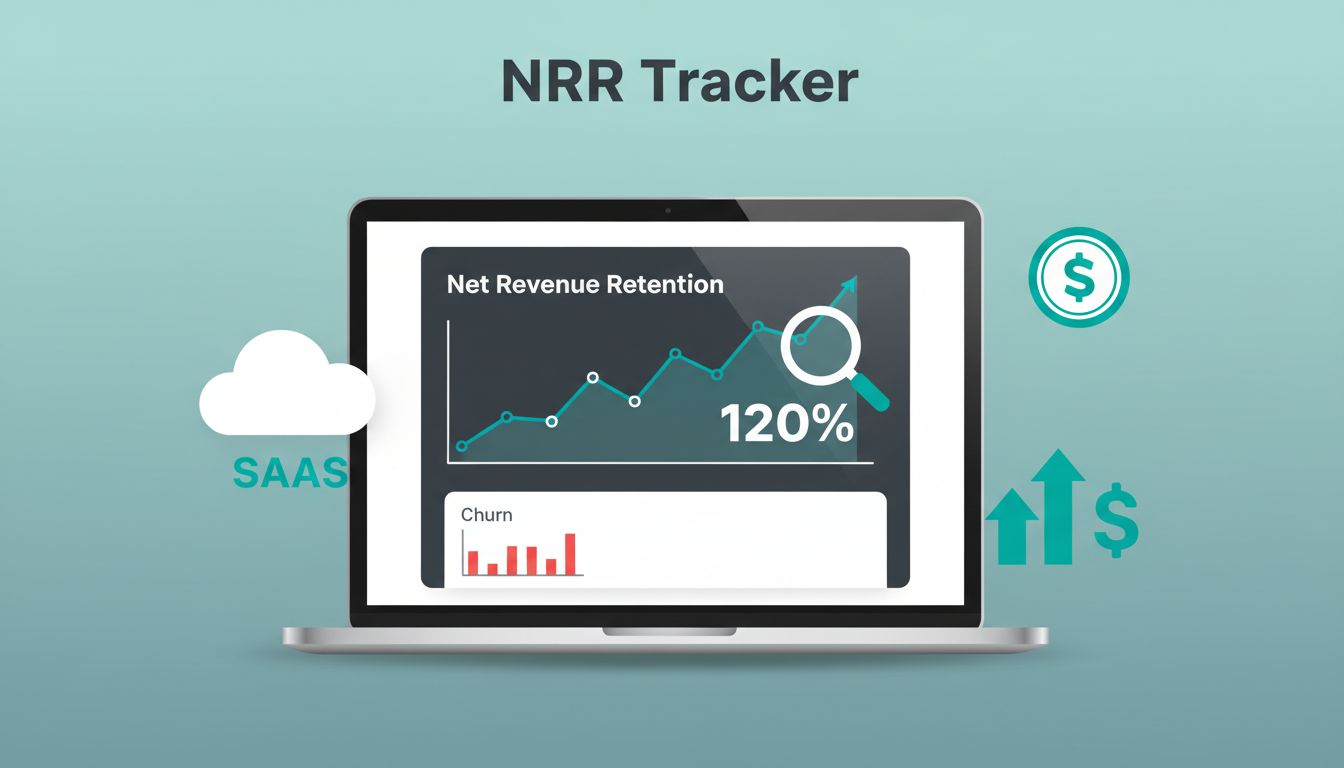
Existing customers decide whether a SaaS business grows or leaks. Baremetrics net revenue retention measures this with one percentage. The number shows how much recurring revenue remains after cancellations, downgrades, and upgrades from the customers already on the books. This guide explains the NRR formula, the companion GRR metric, a worked example, a monthly review
Signups mean little when revenue stays flat. Trial conversion rate shows the share of trials becoming paying customers. Baremetrics reports this number in Trial Insights and refreshes the chart as trials start, convert, and cancel. This guide covers the formula, the setup requirements, the other Trial Insights metrics, the benchmark ranges, and the checks to

