A hiring budget can look fine on paper and still hide a slow leak. When I monitor cost per hire metrics in Recruit CRM, I want one number that tells me whether the process is efficient or just busy.
The hard part is not the math. It’s collecting the same cost categories every time, then matching them to the right hires. Once that is in place, the report starts showing patterns I can act on.
Why I watch cost per hire every month
I treat cost per hire like a monthly pulse check. One quarter can hide a bad source mix, a slow approval chain, or too much manual work. A single annual number rarely shows where the money went.
The standard formula is simple, and I keep it aligned with the breakdown in Recruit CRM’s cost per hire guide:
Cost per hire = (Internal recruiting costs + External recruiting costs) / Number of hires
I care about both sides of the equation. Internal cost covers the time and labor inside the company. External cost covers the spend that leaves the building.
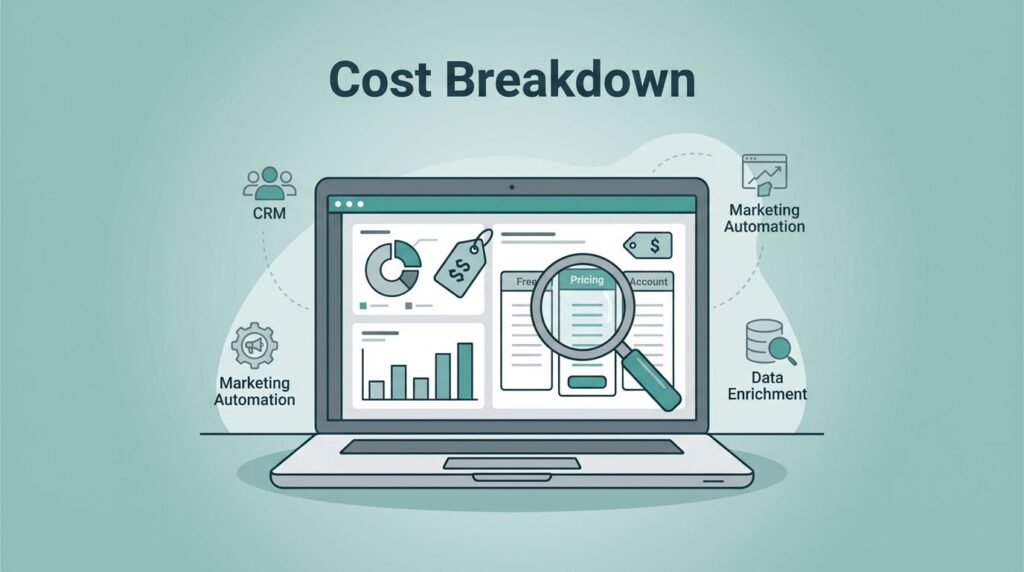
How I set up Recruit CRM for clean cost data
When I build this in Recruit CRM, I start with a clean definition of the reporting period. Month, quarter, and campaign all work, but I pick one and stick with it. If I change the window every time, the trend line becomes noise.
I also decide what I will count before I touch the report. That means deciding whether I track role-level costs, recruiter-level costs, or client-level costs. In my setup, the exact workflow depends on the plan, configuration, and any connected tools I use, so I do not assume every team will track it the same way.

For a broader setup flow, I often lean on my Recruit CRM setup guide for agencies so the fields and pipelines stay consistent.
Then I map cost sources to the same record structure every time. That usually includes the job, the recruiter, the source channel, and the final hire count. If I have access to reporting fields or custom fields, I use them for the cost tags. If not, I keep the source data in a connected sheet and reconcile it on a fixed schedule.
Calculating cost per hire without guesswork
I like to separate internal and external recruiting costs before I calculate anything. That keeps the number honest and makes it easier to explain later.
| Internal recruiting costs | External recruiting costs |
|---|---|
| Recruiter salaries and benefits | Job board ads |
| Hiring manager interview time | Agency fees |
| Coordinator or admin time | Background checks |
| Training and onboarding setup | Assessment tools |
| Referral bonuses | Travel or relocation support |
The cleanest way to calculate the metric is to total those costs for the same period, then divide by the number of hires in that period. If a role stays open across two months, I count it according to the reporting rule I set up, not by memory.
Here are two sample calculations I use as a sanity check:
- Internal costs of $9,500 plus external costs of $3,500 equal $13,000. With 5 hires, cost per hire is $2,600.
- Internal costs of $36,000 plus external costs of $44,000 equal $80,000. With 20 hires, cost per hire is $4,000.
I trust the number only when I can explain every dollar behind it.
That second example is common when volume rises and the team leans on more paid sourcing or extra hands. It is also the kind of report that helps me spot a source channel that looks cheap at first but gets expensive after rework.
KPIs I pair with cost per hire
Cost per hire tells me what I spent. The next question is whether I spent it well. For that, I pair it with other recruiting KPIs, similar to the group covered in this recruitment analytics guide.
The metrics I check most often are:
- Time to hire, because slow hiring often pushes cost up.
- Offer acceptance rate, because dropped offers waste recruiter time.
- Source quality, because cheap sources can still create bad outcomes.
- Interview-to-offer ratio, because too many interviews add hidden labor.
- Recruiter workload, because overloaded teams miss follow-up and lose candidates.
When cost per hire rises while time to hire falls, I usually look for expensive channels or rushed approvals. When cost stays low but acceptance rates fall, I know the process may be saving money in the wrong place.
Building a repeatable reporting process
A repeatable report is better than a perfect one that appears once. I keep mine simple so I can run it every month without starting over.
First, I freeze the cost categories. Then I close the period on the same date each month. After that, I review the report by source, recruiter, job type, and client if the data supports it.
If I work in an agency setup, I also compare the report with the operating model I use in my staffing agency CRM review. That helps me see whether the CRM structure matches the way the team actually hires.
Finally, I keep a short exception log. If a month looks odd, I note why. Maybe a large agency fee hit late. Maybe a hiring freeze changed the mix. Maybe one role took longer than planned. Those notes save me from guessing six months later.
Conclusion
When I track cost per hire in Recruit CRM, I’m not chasing a vanity number. I’m watching whether my hiring process is steady, messy, or drifting out of control.
The best reports are the ones I can repeat. When the data is clean, the formula is simple, and the KPI set is consistent, cost per hire becomes a useful decision tool instead of a spreadsheet chore.