Energy Tracking Automation With Twin.so
Energy teams rarely lack data. They lack a repeatable way to turn utility bills, meter readings, and interval feeds into decisions. Energy tracking automation with Twin.so can reduce manual collection and give each site a consistent reporti...


Energy teams rarely lack data. They lack a repeatable way to turn utility bills, meter readings, and interval feeds into decisions. Energy tracking automation with Twin.so can reduce manual collection and give each site a consistent reporting routine.
The work starts before you build a dashboard. Define the source data, standardize the units, set KPI rules, and route exceptions to the people who can act. Then let scheduled workflows handle the recurring report cycle.
Why Energy Tracking Automation Needs a Reliable Data Layer
Manual energy reporting breaks at predictable points. A utility invoice arrives late. A meter export uses kWh while another system reports MWh. A site manager changes a spreadsheet formula, and the next monthly report no longer matches the previous one.
These issues create more than administrative work. They affect budget forecasts, sustainability disclosures, maintenance priorities, and operating decisions. Leaders may see a higher energy cost without knowing whether the cause was consumption, demand charges, a tariff change, or an estimated bill.
Energy data also comes from several systems:
- Utility invoices and billing portals
- Building management systems
- Smart meters and submeters
- On-site solar or battery systems
- Finance and enterprise resource planning platforms
- Emissions-factor databases
Each source has its own naming conventions, date ranges, units, and update schedule. A useful workflow must bring those records into a common structure before it calculates performance.
The U.S. Department of Energy’s utility data guidance emphasizes improving access to utility-billing data as part of a stronger energy data management process. The same principle applies when you use Twin.so. Automating a poor data process only produces reports faster. It doesn’t make the reports trustworthy.
EnergyCAP provides another useful reference point for teams reviewing energy and utility management software. Its platform focuses on organizing utility data, costs, and usage records in one operating environment. Twin.so can fit into a similar reporting architecture when its available inputs and workflow functions match your requirements.
Build an Energy Data Pipeline in Twin.so
Use Twin.so as the workflow layer between operational data and recurring reports, subject to the connectors, imports, scheduling, and output options available in your workspace.
Start with a small pilot. Choose one building, one business unit, or one utility account. A limited scope makes data problems easier to isolate before you expand across the portfolio.


Use this implementation sequence:
- List every energy source and owner. Record the account number, site, meter ID, utility, data owner, billing period, and expected update frequency. Assign a person to resolve missing or disputed records.
- Create a common data structure. Use consistent field names for site, meter, timestamp, commodity, quantity, unit, cost, and source. Store electricity, gas, steam, chilled water, and fuel as separate commodities.
- Set calculation rules before importing historical data. Define how you handle taxes, demand charges, credits, estimated reads, partial billing periods, and tariff changes. Write the rules in plain language so finance and operations teams use the same method.
- Separate raw data from calculated data. Keep the original invoice or meter record unchanged. Store normalized values and calculated KPIs in separate fields. This gives you a traceable path when someone questions a figure.
If Twin.so supports document intake, API connections, scheduled imports, or database workflows, configure only the sources needed for the pilot. Avoid connecting every system on day one. Prove that one complete reporting path works first.
Choose KPIs That Lead to Action
A report should show more than whether energy use went up or down. Each KPI needs a clear operating purpose and a defined calculation.
| KPI | Typical unit | Operational use |
|---|---|---|
| Consumption | kWh or MWh | Tracks total energy used by site, asset, or period |
| Cost | Currency | Supports budget control and invoice review |
| Demand | kW or MW | Identifies peak-load exposure and demand-charge risk |
| Energy intensity | kWh per square foot or production unit | Compares sites with different sizes or output |
| Emissions | kg or metric tons CO2e | Supports carbon reporting and reduction planning |
| Variance | Percentage or currency | Flags results outside the expected baseline |
Consumption is usually the starting point. The workflow should sum valid meter intervals or billing-period values without mixing units. If one source reports kWh and another reports MWh, convert them before aggregation.
Cost needs its own logic. A higher bill may result from higher consumption, a new tariff, a demand spike, a fixed charge, or a correction from the utility. Keep the invoice total and its components available when possible.
Demand requires time-based data. A monthly consumption total won’t show the 15-minute or 30-minute peak that drives a demand charge. If demand data isn’t available, label the KPI as unavailable instead of estimating it from consumption.
Intensity gives managers a fairer comparison across buildings or operating periods. A larger facility may consume more energy but perform better per square foot. Manufacturing teams may use production volume as the denominator.
Emissions calculations depend on the emissions factor. Store the factor, unit, source, geography, and reporting period with the result. Never present an emissions number without preserving the rule behind it.
Automate Reports Around the Operating Cadence
The best energy reports arrive when someone can act on them. A daily exception report has a different audience and purpose than a monthly executive summary.
Set three reporting levels if the available Twin.so workflow features support scheduled delivery:
- Daily or near-real-time exceptions for unusual consumption, missing data, peak demand, or equipment issues.
- Weekly site reports for facilities managers and energy leads who review trends and assign actions.
- Monthly portfolio reports for finance, sustainability, and operations leadership.
Each report should answer three questions:
- What changed?
- Why did it change?
- Who owns the next action?
A report that shows a 14% increase in electricity use is incomplete. It should identify the site, comparison period, affected meter, data confidence, and likely cause when the available data supports that conclusion.
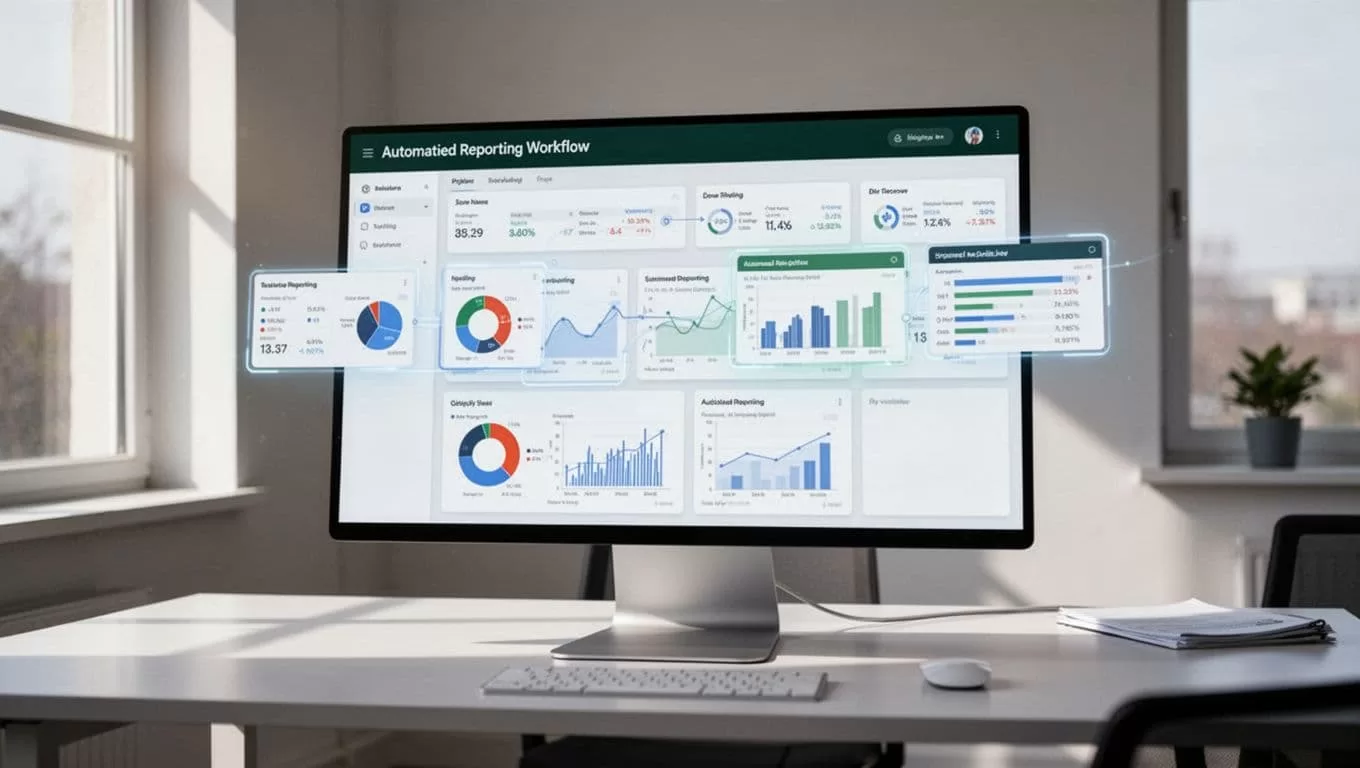
Build the workflow around events, not only dates. A monthly report can run on the fifth business day after all expected invoices arrive. An exception report can run when demand exceeds a defined threshold or when a meter has missing intervals.
Use clear report names and stable destinations. If Twin.so supports email, collaboration tools, file storage, or database outputs, restrict each report to the channel its audience already uses. Don’t send a site technician a portfolio-level report with no assigned task.
Add a short data-status block to every report. It should show the reporting period, number of sites included, missing sources, estimated records, and last successful refresh. This prevents readers from treating an incomplete report as a complete result.
Add Controls Before Reports Reach Executives
Automation needs validation. Without controls, a workflow can distribute an incorrect number to every stakeholder before anyone reviews it.
Create checks for the most common data failures:
- Missing billing periods
- Duplicate invoices
- Negative or zero consumption where it isn’t expected
- Sudden changes outside a defined tolerance
- Unit mismatches
- Meter readings that move backward
- Costs that don’t reconcile with the invoice
- Emissions records missing a factor or source
Use thresholds based on the site and asset. A 20% change may be normal for a seasonal facility and abnormal for a stable office. Fixed thresholds work for simple portfolios, but site-level baselines produce better alerts.
Keep data confidence visible. Mark records as actual, estimated, corrected, or manually entered. A manager can decide whether to approve an operational action when the report shows that the underlying bill is estimated. Without that status, the same decision becomes guesswork.
Access control also matters. Utility invoices can contain account identifiers, payment information, and facility details. Give users the minimum access needed for their role. Separate people who maintain source data from people who approve reporting logic.
For teams comparing Twin.so with broader energy management options, Parsons’ energy management solutions provide a useful reminder that analytics and operational controls often sit together. Your selection criteria should cover both reporting automation and the actions that follow the report.
A scheduled report is not complete until it shows data coverage, calculation status, and an owner for exceptions.
Measure the Results of the Workflow
Track the reporting process itself. Energy savings may take months to verify, but workflow improvements can be measured immediately.
Record a baseline before deployment:
- Hours spent collecting and consolidating data
- Number of manual spreadsheet steps
- Average time from billing close to report delivery
- Percentage of sites reported on time
- Number of corrections after distribution
- Percentage of records marked estimated or missing
- Time required to identify the cause of a variance
Review those measures after the pilot. A successful workflow should reduce repetitive entry, shorten the reporting cycle, and make exceptions easier to assign. It should also improve consistency between finance, facilities, and sustainability reports.
Don’t measure success by automation volume. A workflow that imports thousands of records but produces unclear KPIs has low operational value. Focus on whether managers can find a reliable number, understand its cause, and act without rebuilding the analysis.
Expand only after the pilot meets its data-quality and delivery targets. Add sites in groups. Review the same controls after each expansion because new utilities and building types introduce new exceptions.
Conclusion
Energy tracking automation works when data collection, calculations, validation, and delivery follow one defined process. Twin.so can support that process when its available integrations and workflow features match your data environment.
Start with one reporting path. Normalize the source records. Track consumption, cost, demand, intensity, and emissions with documented rules. Then automate reports around the decisions each audience needs to make.
The goal isn’t more dashboards. It’s a dependable reporting system that shows what changed, identifies the next action, and gives energy teams fewer manual steps to manage.

