How to Design and Run a Feature Comparison Table Test With Mida.so
Most SaaS pricing and product pages leak high-intent visitors because their comparison blocks hide crucial information. You drive traffic through paid ads and organic search, yet visitors struggle to evaluate which plan fits their workload....

Most SaaS pricing and product pages leak high-intent visitors because their comparison blocks hide crucial information. You drive traffic through paid ads and organic search, yet visitors struggle to evaluate which plan fits their workload. Guessing what layout or feature set to display next won’t fix your conversion bottlenecks. You need a systematic optimization process to test how structured data affects user decisions.
Mida.so gives you the lightweight infrastructure needed to experiment on your pages without writing heavy code. When you run a feature comparison table test, you can measure exactly which layout updates turn evaluators into active accounts.
Key Takeaways
- Establish your baseline conversion rates and traffic stability in analytics before launching any comparison table experiment.
- Formulate clear hypotheses based on specific user friction points rather than making random design tweaks.
- Monitor segment performance across mobile devices and paid traffic sources instead of relying solely on aggregate totals.
- Define strict decision rules and statistical confidence thresholds before checking live test results to prevent false positives.
- Document every win or loss inside an internal log to build a reliable knowledge base for future campaigns.
Establishing Your Baseline Data Before Launching
You cannot improve what you refuse to measure. Before you touch a single line of code or draft a new headline, pull your current conversion metrics directly from Google Analytics 4. Industry research shows that average performance varies wildly by vertical, traffic source, and device type. Mobile visitors rarely convert at the same rate as desktop users, and paid search traffic behaves differently than organic social clicks.
Look past your blended store average and inspect specific funnel steps. Calculate your drop-off rates from pricing views to trial starts. Record your baseline speed, conversion rate, and traffic profile before you add any experiment script. Run several checks instead of relying on one automated scan. Lab tools can show how a page behaves, but real user monitoring reveals actual interaction delays.
If your baseline data is noisy or incomplete, your experiment analysis will yield unreliable conclusions. Document your current conversion rate, bounce rate, and core traffic distribution across mobile and desktop devices. For a deeper look at how leading platforms connect attribution data to forecasting, review top marketing attribution software solutions.
Formulating a Strong Hypothesis for Your Table
A weak hypothesis ruins an experiment before it starts. Saying you want to see if a new table layout performs better is not enough. You need a specific link between an observed user problem and a measurable change.
Write your hypothesis in one simple sentence. State what you are changing, where the change happens, and why you expect users to respond. For example, changing the pricing page comparison matrix from a dense multi-column grid to a simplified three-tier checklist will increase trial signups because users can parse feature limits faster.
┌─────────────────────────────────────────────────────────┐
│              FEATURE COMPARISON TEST PLAN               │
├───────────────────┬─────────────────────────────────────┤
│ Control           │ Current multi-column pricing grid   │
│ Variant           │ Simplified collapsible feature list │
│ Primary Metric    │ Trial signup conversion rate        │
│ Guardrail Metric  │ Mobile bounce rate and page speed   │
└───────────────────┴─────────────────────────────────────┘
Create the control version first. The control is your current page receiving the standard experience. Then build one meaningful variant. Testing five unrelated changes at once can produce a winner, but it won’t tell you which change caused the result. Apply the smallest possible modification that answers your core question.
Setting Up Your Experiment in Mida.so
Mida.so lets you design landing-page variants and launch experiments without writing custom code. Open your workspace and navigate to the visual editor to begin configuring your test variations.
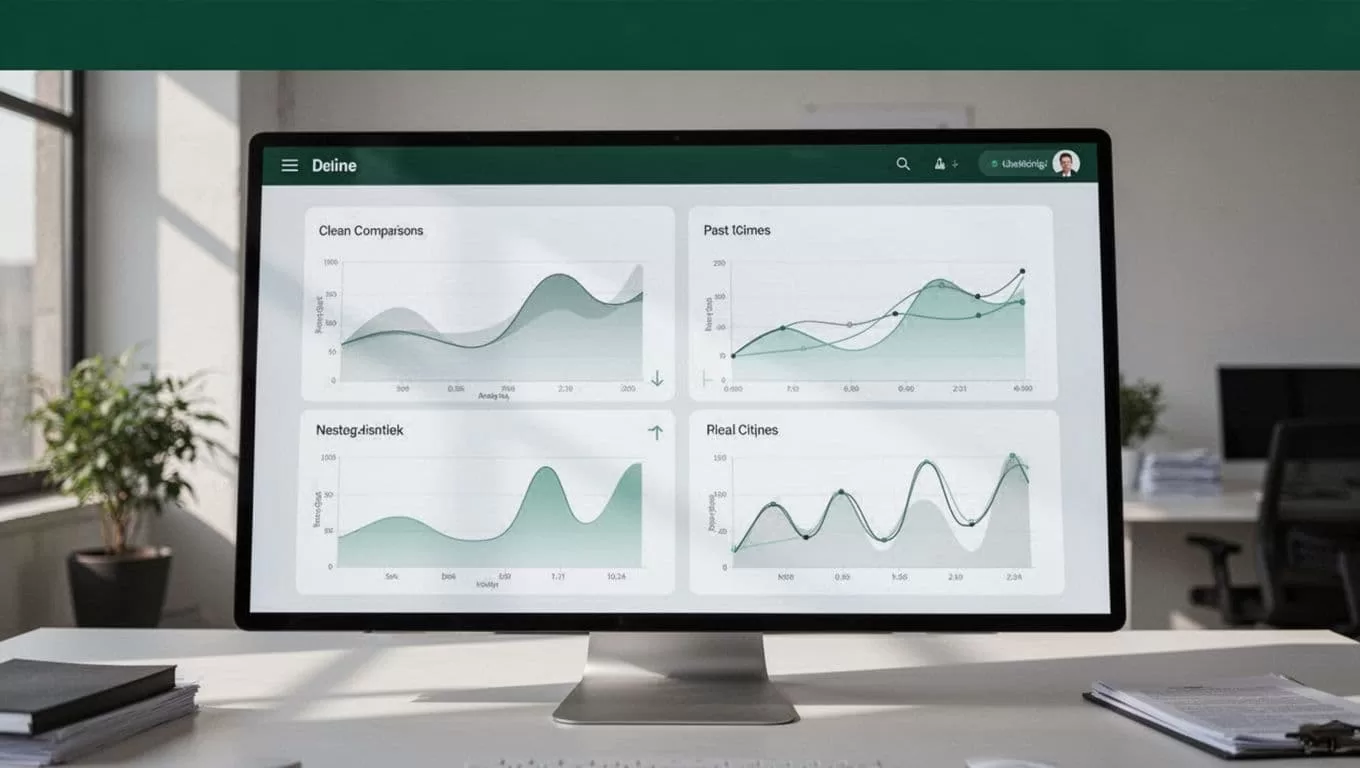
Set your traffic allocation to a fifty-fifty split to give both experiences equal exposure. Keep those rules steady while the test is active. Altering targeting mid-stream creates a new test condition, corrupting sample purity and forcing you to restart your measurement window.
Configure your targeting rules precisely. If your comparison table update specifically targets mobile visitors or paid search traffic, apply those audience parameters before launching. You can learn more about platform capabilities by exploring Mida’s A/B testing software features. Exclude internal company traffic, automated bots, and visitors already enrolled in conflicting experiments to keep your data clean.
Reading Test Results With Business Context
Too many teams declare a test winner based entirely on a raw statistical significance percentage. A report needs more than a headline lift to justify permanent deployment. Compare your control group against the variant under identical conditions, and check whether the winning metric holds steady across key audience segments.
| Segment Category | Key Focus Metric | Potential Risk to Monitor |
|---|---|---|
| Mobile Traffic | Conversion Rate | Form usability and layout shifts |
| Paid Search | Cost per Acquisition | Lead quality and downstream sales value |
| Returning Visitors | Engagement Depth | Unintended friction on repeat navigation |
Review absolute conversion numbers alongside percentage changes. A minor lift derived from a handful of transactions can easily trick an eager team into deploying a losing variant. Wait until you hit your required sample size and achieve statistical confidence before making permanent changes to your product pricing or core messaging.
A winning percentage on a dashboard does not guarantee a profitable campaign rollout if the underlying traffic sample consists of low-intent visitors who never reach activation.
Check whether your results remain consistent across important audience segments. Mobile visitors, paid acquisition traffic, and organic search visitors often respond differently to visual changes on the page. A variant that wins overall may perform poorly for the exact audience segment that drives your core revenue. For broader context on maintaining search visibility during conversion optimization campaigns, explore this guide on how A/B testing and personalization impact SEO.
Preventing Common Experimentation Mistakes
Growth teams often undermine their own experiments by making decisions too quickly or ignoring basic statistical rules. You need a pre-planned decision framework before looking at live data. Avoid checking your dashboard every hour and stopping the test the moment a variant takes a temporary lead. Random traffic fluctuations during the first forty-eight hours create false positives.
Another common error is running several overlapping experiments on the same page. If one test changes the headline and another changes the comparison table at the same time, you cannot isolate which element drove the change. Schedule related tests sequentially or use a planned multivariate design when your traffic volume supports it.
Keep your eyes on guardrail metrics as well. A new comparison table might increase initial click rates while slowing down page rendering or introducing mobile layout shifts. If your core performance metrics decline, revise the variant even if conversion rates tick upward. For alternative deployment workflows and tool comparisons, review this Fast AI A/B testing alternative.
Documenting and Shipping Your Results
When your test reaches statistical significance, record the outcome inside your internal experiment log. Classify the result as won, lost, inconclusive, or technically invalid based on your data guardrails.
If the variant wins, define the permanent implementation steps for your development team. If the test loses, document what the outcome rules out so your team doesn’t repeat the same mistake next quarter. To explore how lightweight optimization platforms fit into your broader tech stack, visit the main Mida platform overview.
Keep your stakeholders informed with clear reports that outline what you changed, what the experiment measured, and what the financial impact was. Conclude every test cycle by feeding verified learnings back into your team knowledge base so future optimization efforts build directly on past data.
