A product can look hot and still fail fast. I’ve seen that happen when the chart was exciting, but the demand was thin.
That’s why I use Google Trends product research as a filter, not a verdict. It helps me spot direction, timing, and seasonality before I spend money on stock, ads, or content. Then I compare that signal with marketplace data, keyword tools, and real buyer chatter.
I start with a broad product idea, not a perfect keyword
In 2026, I still treat Google Trends as a fast first pass. I open Explore, compare a few product terms, and check whether I’m looking at a topic, a search term, or a narrow phrase. Topic mode is useful because people search in messy ways, and Trends often groups those variations better than a single exact term.
I also change the time range early. A 12-month view helps me see a live trend, while a 5-year view shows whether demand repeats. If a product is local, I look at state or metro data too. That can matter for things like summer gear, regional hobbies, or city-specific gifts.
When I want a wider read on a product idea, I compare it with my trend spotting process with Exploding Topics. Google Trends shows movement. Broader trend tools help me see whether the market was already waking up.


A rising chart is only useful when the problem behind it is real.
I read the curve before I trust the signal
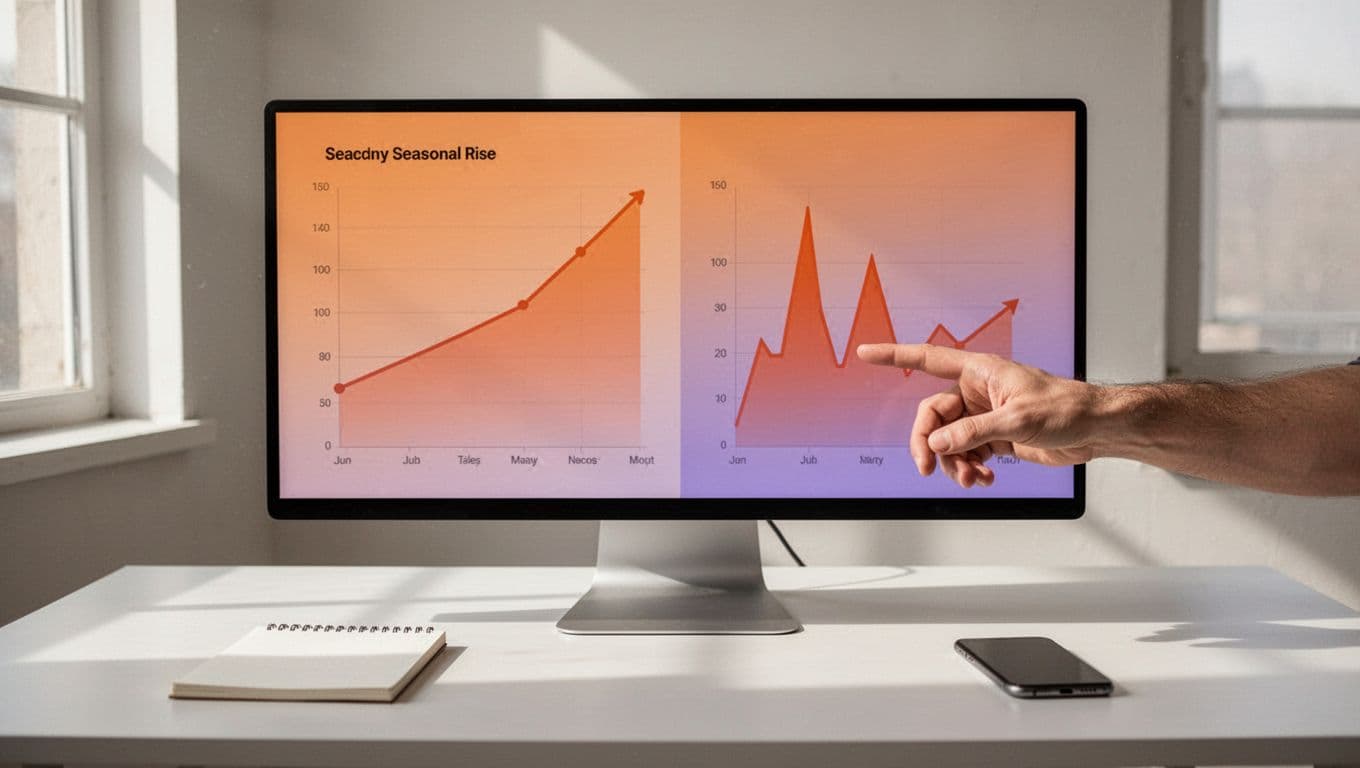
The shape of the line matters more than the excitement around it. A steady climb tells me interest is building. A sharp spike that disappears tells me to slow down.
I also remember that Trends uses relative interest. A score of 100 means the peak in that chart, not the size of the whole market. That matters a lot. A tiny niche can look dramatic if the search base is small.
This table is how I sort the pattern quickly:
| Trend shape | What it usually means | My next move |
|---|---|---|
| Steady climb | Demand is building | Keep researching |
| Sharp spike then drop | Hype or a fad | Test small or skip |
| Repeating yearly peaks | Seasonal demand | Plan ahead |
| Flat, noisy line | Weak interest | Move on |
The “Related queries” panel helps here too. If I see rising related terms, I pay closer attention. If the related terms are random or thin, I slow down. I want a product that has room to branch into bundles, accessories, or repeat buys.
For a second lens on new product angles, I often check new ecommerce niche research. That keeps me from mistaking one noisy term for a real market.
I separate fads, seasonal products, and real demand
This is where a lot of sellers get burned. A fad can still make money, but only with speed and tight risk control. A seasonal product can be great, but only if I plan for the right window. A durable product has repeat demand and a clearer path to profit.
I look for three signs of seasonality. First, the same peak returns each year. Second, the curve starts rising early enough for me to stock or publish ahead of time. Third, the demand lines up with a real calendar event, like summer travel, back-to-school, or holiday gifting.
For launch timing, I use seasonal product launch planning. That helps me map demand to the buying window instead of reacting after the peak passes.
I treat fads differently. If a product spikes hard, shows weak repeat interest, and has little add-on potential, I keep the test tiny. I don’t want to build around a short burst unless I can move very fast. For Amazon sellers, that often means low inventory and strict ad tests. For dropshippers, it means small ad budgets and fast feedback. For niche site owners, it may mean a short content test instead of a full site.
I cross-check Google Trends with marketplace and keyword data
Google Trends tells me what direction demand is moving. It does not tell me whether people buy. So I cross-check with other sources before I commit.
I like the way Shopify’s Google Trends product guide pairs trend data with store decisions. I also like AdsX’s 2026 walkthrough for Shopify sellers because it shows the same habit in a store context. Both remind me to look past the chart.

My usual cross-check stack looks like this:
- I search the product on Amazon, Etsy, or another marketplace to see how crowded the shelf feels.
- I scan keyword tools for search volume, commercial terms, and long-tail phrases.
- I check social posts, Reddit threads, and comments for pain points or wish lists.
- I read reviews to find the complaints people keep repeating.
- I compare competitors to see whether they all sound the same.
That mix protects me from false positives. A tiny trend can look sharp in Trends, yet still lack enough demand to matter. Another product can look boring in search data but have strong buying intent, especially if the reviews show urgent pain.
I turn the signal into a small, cheap test
Once the data looks real, I do not go all in. I run a narrow test first.
- I pick one clear buyer type.
- I choose one product angle.
- I test one channel, usually a landing page, ad, or marketplace listing.
- I watch for saves, clicks, add-to-cart actions, or email signups.
If the test gets traction, I expand. If it stalls, I keep the loss small and move on. That simple habit saves time, cash, and inventory mistakes.
When I want another angle on timing and demand, I sometimes check early consumer trends 2026. It helps me decide whether a signal is still forming or already fading.
For me, the best product research feels calm, not rushed. I want a product with a clean curve, a real buyer, and enough room to grow. Google Trends gives me the first clue, but the sale still depends on what I find after that.
The chart is only the beginning. The money is in the validation.