Launch Popup A/B Testing Using Mida.so
Most websites suffer from silent exits. You pay for ads, publish content, and watch analytics dashboards log steady traffic, but visitors leave without subscribing, buying, or booking a demo. A targeted overlay or lead capture widget offers...
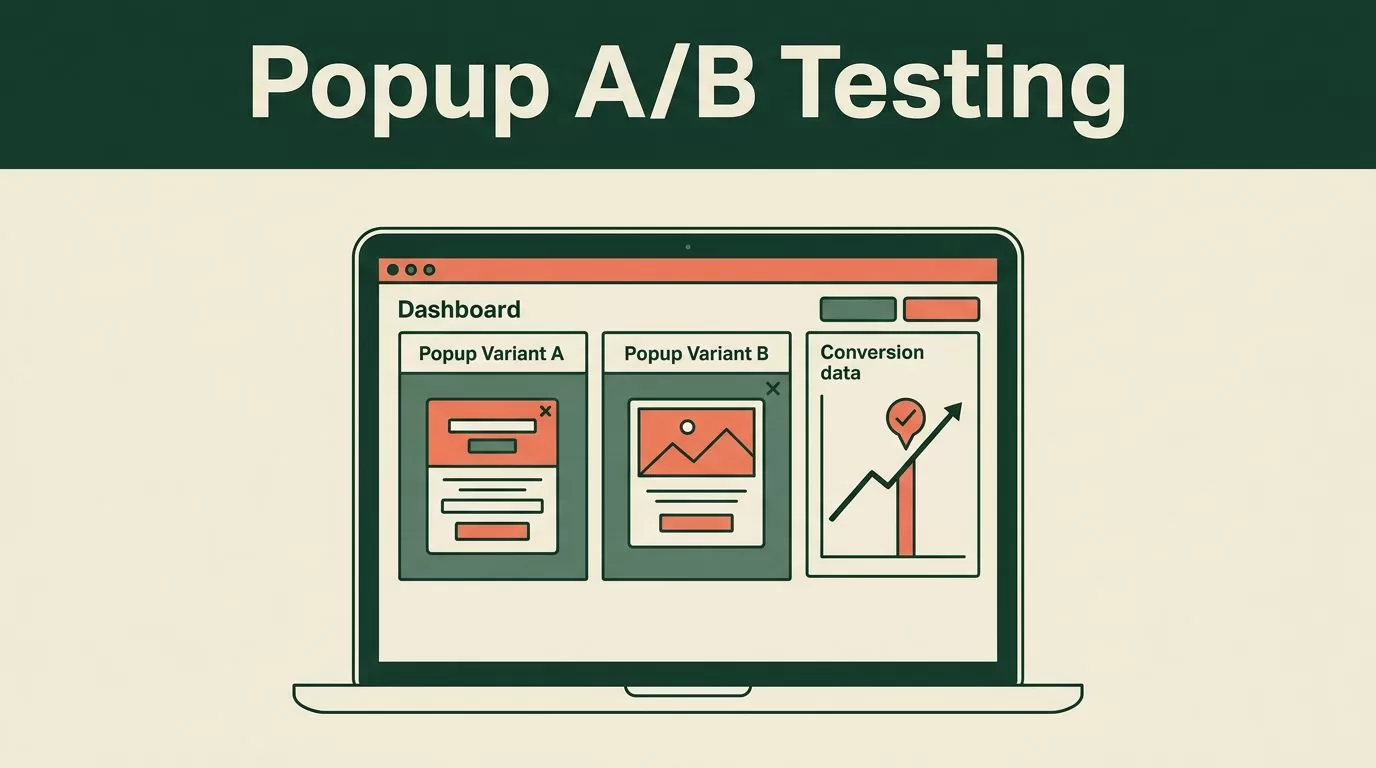
Most websites suffer from silent exits. You pay for ads, publish content, and watch analytics dashboards log steady traffic, but visitors leave without subscribing, buying, or booking a demo. A targeted overlay or lead capture widget offers a final chance to capture attention, yet guessing which message works leads to frustrating campaigns that annoy users instead of converting them. Effective popup A/B testing turns those guesswork tweaks into a systematic revenue channel.
You need more than default platform templates or subjective design debates. When you build structured experiments inside Mida.so, you replace assumptions with verified visitor responses. This operational playbook explains how to establish baselines, isolate variables, avoid common traps, and interpret your test results with real business context.
Key Takeaways
- Establish baseline conversion rates and traffic stability before launching any new experiment on your pages.
- Formulate clear hypotheses based on user friction points rather than random design tweaks.
- Monitor segment performance across mobile devices and paid traffic sources instead of relying solely on aggregate totals.
- Define strict decision rules and statistical confidence thresholds before checking live test results to prevent false positives.
- Document every completed test outcome to build a reliable internal knowledge base for future campaigns.
Establishing Baselines Before You Touch the Editor
You cannot improve what you refuse to measure. Before you draft a new headline or configure a new capture form, pull your current conversion metrics directly from your analytics suite or from resources covering conversion rate optimization tools. Industry benchmarks show that performance varies wildly by traffic source, device type, and industry vertical. Mobile visitors rarely convert at the same rate as desktop users, and paid search traffic behaves differently than organic social clicks.
Look past your blended average and inspect specific funnel steps. Calculate your drop-off rates from pricing page views to form starts, and from form starts to completed signups. If your baseline data is noisy or incomplete, your experiment analysis will yield unreliable conclusions.
Traffic allocation controls how visitors enter your test. A standard setup uses a fifty-fifty split, giving both experiences equal exposure. Keep your targeting rules precise. If your overlay update specifically targets mobile visitors or paid search traffic, configure those audience parameters before launching. Keep your traffic distribution steady and avoid changing audience rules while the test is active. Altering the targeting mid-stream creates a new test condition, corrupting your sample purity and forcing you to restart the measurement period.
Formulating Clear Hypotheses and Test Variations
Random design changes waste valuable traffic. Every test needs a direct connection between an observed user problem and a measurable change. If visitors abandon your pricing page without subscribing, your hypothesis should address the specific objection holding them back.
Test one meaningful change at a time so your results point to an unambiguous winner. If you change the headline, the offer, and the background color simultaneously, you won’t know which element drove the conversion shift.
Actionable popup test examples focus on distinct tactical levers:
- Offer variation: Test a fifteen percent discount against a free shipping threshold to see which incentive moves buyer intent.
- Headline clarity: Compare a feature-focused headline against a direct benefit statement that answers the primary visitor objection.
- Timing and triggers: Experiment with exit-intent activation versus a timed forty-five-second delay to measure user reception.
- Form fields: Test a single email input field against a multi-step form that requests company size and role.
Keep control pages stable and isolate your variables. When you launch the experiment in Mida.so, double-check that your tracking pixel fires once and only once per successful action. Testing multiple variables at once turns your optimization program into an expensive guessing game.

Preventing Common Experimentation Mistakes
Growth teams often undermine their own experiments by making decisions too quickly or ignoring basic statistical rules. You need a pre-planned decision framework before looking at live data. Avoid checking your dashboard every hour and stopping the test the moment a variant takes a temporary lead. Random traffic fluctuations create false positives if you call a winner too early.
Another frequent error is running several overlapping experiments on the same page. If one test changes the main headline and another triggers a conflicting overlay, you cannot attribute the conversion shift to either change. Schedule related tests sequentially or use a planned multivariate design when your traffic volume supports it.
A winning percentage on a dashboard doesn’t guarantee a profitable campaign rollout. You must evaluate raw conversion counts alongside percentage lifts to understand the real financial impact.
You must also protect site performance. Most experimentation tools rely on heavy client-side scripts that execute synchronously or block the main thread. If a heavy overlay bundle delays your layout rendering by half a second, the user frustration cancels out the design improvement. Keep your tracking scope limited to the specific pages that require testing, and treat page load speed as a hard guardrail.
Reading Test Results With Business Context
A report needs more than a winning percentage to justify a permanent deployment. Start by inspecting your primary metric and comparing your control version against the variant under identical test conditions. Check how many visitors entered each variation before drawing conclusions. A test cannot produce a reliable comparison if one variation receives the bulk of your traffic due to uneven routing.
Calculate your conversion rate accurately by dividing total conversions by total exposures, then multiplying by one hundred. Treat early results as directional rather than final. Review your sample size and experiment duration before choosing a winner.
| Metric Type | What It Measures | Common Pitfall |
|---|---|---|
| Exposures | Number of users entering each variation | Uneven traffic splits skewing confidence |
| Conversion Rate | Percentage of visitors completing the primary goal | Relying on tiny sample sizes |
| Guardrail Metrics | Page load speed, error rates, and bounce rates | Ignoring negative side effects on mobile |
An overall conversion win can hide important differences. Segment your performance data by device type and traffic source. A variation that wins overall among organic visitors might fail completely for paid traffic arriving from mobile ad placements. For a deeper look at how leading platforms connect attribution data, you can review the ultimate conversion rate optimization guide to benchmark your reporting methods.
Review absolute numbers alongside percentage changes. A minor lift derived from a handful of transactions can easily trick an eager team into deploying a losing variant. Wait until you hit your required sample size and achieve statistical confidence before making permanent changes to your capture workflows.
Documenting and Shipping Your Winning Experiments
When your test reaches statistical significance, record the outcome inside your experiment log. Classify the result as won, lost, inconclusive, or technically invalid based on your data guardrails.
If the variant wins, define the permanent implementation steps for your development team. If the test loses, document what the outcome rules out so you don’t repeat the same mistake in future quarters. For broader insights on selecting optimization platforms, explore these insights on CRO tools to evaluate your tooling stack.
Store the result alongside your original hypothesis and recommendation. This workflow gives stakeholders a clear status update and stops your team from presenting a dashboard without a decision attached. Keep your experiment log outside Mida.so to track past hypotheses, traffic allocations, and outcome notes for long-term organizational learning.
Conclusion
Improving your conversion metrics is an ongoing operational discipline rather than a one-time project. You build sustainable growth by replacing gut feelings with structured experiments that target real user friction. Keep your test hypotheses focused, protect your sample sizes, and document every completed test outcome to build a reliable internal knowledge base. Review your active test configurations today and verify that your event payloads flow cleanly into your reporting views.
