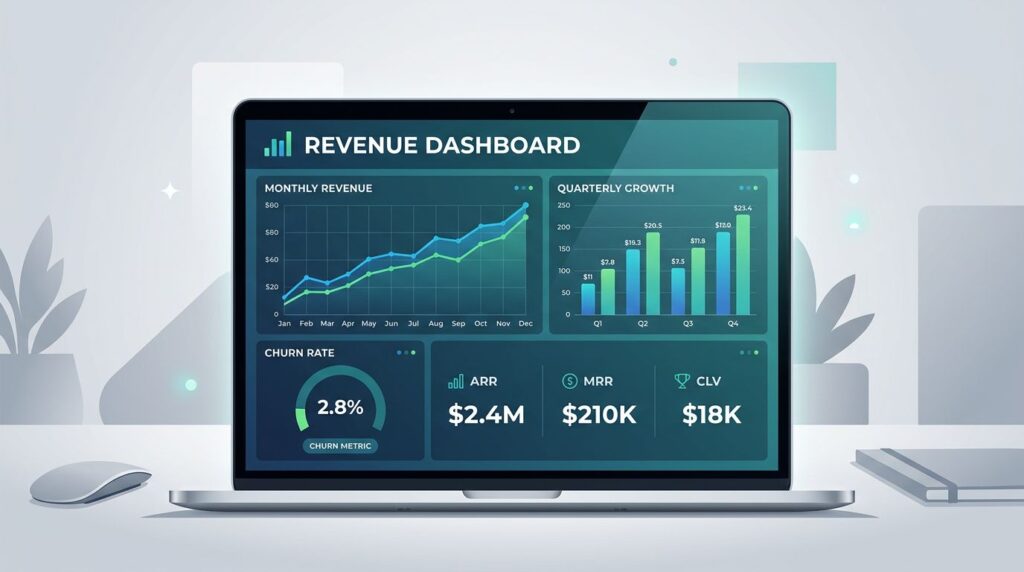
A SaaS business can look healthy and still leak revenue in plain sight. I use Baremetrics to compare MRR, churn, LTV, and failed payments against similar companies, so I can see where my numbers are normal and where they are drifting.
Once I have that reference line, I can stop guessing about pricing, retention, and spend. That is where saas growth benchmarking pays off.
Start with a peer set, not a mood
I do not trust a dashboard alone. A rising MRR graph can hide weak retention, and a low churn rate can hide slow acquisition.
That is why I start by comparing my business with companies that look like mine. Baremetrics does this through Benchmarks, and it sorts results by lower, median, and upper quartiles. It also groups companies by ARPU, which matters because a low-priced product and a high-ACV product should not sit in the same comparison bucket.
For a broader framework, I use my SaaS growth benchmarking playbook before I open Baremetrics. It helps me decide what kind of company I want to compare against, and it keeps me from chasing the wrong signal.


A benchmark is a reference line, not a verdict.
I treat the median as a guide, not a finish line. If my business has a different sales cycle, price point, or customer mix, I want direction, not blind imitation.
Open Baremetrics Benchmarks the right way
I keep the setup simple. First, I open Benchmarks in Baremetrics. Next, I check the metric I care about most, then I match the ARPU band as closely as I can.
That order matters because the same growth rate can mean different things in different businesses. A product with strong self-serve motion should not be judged the same way as a sales-led SaaS with long deal cycles.
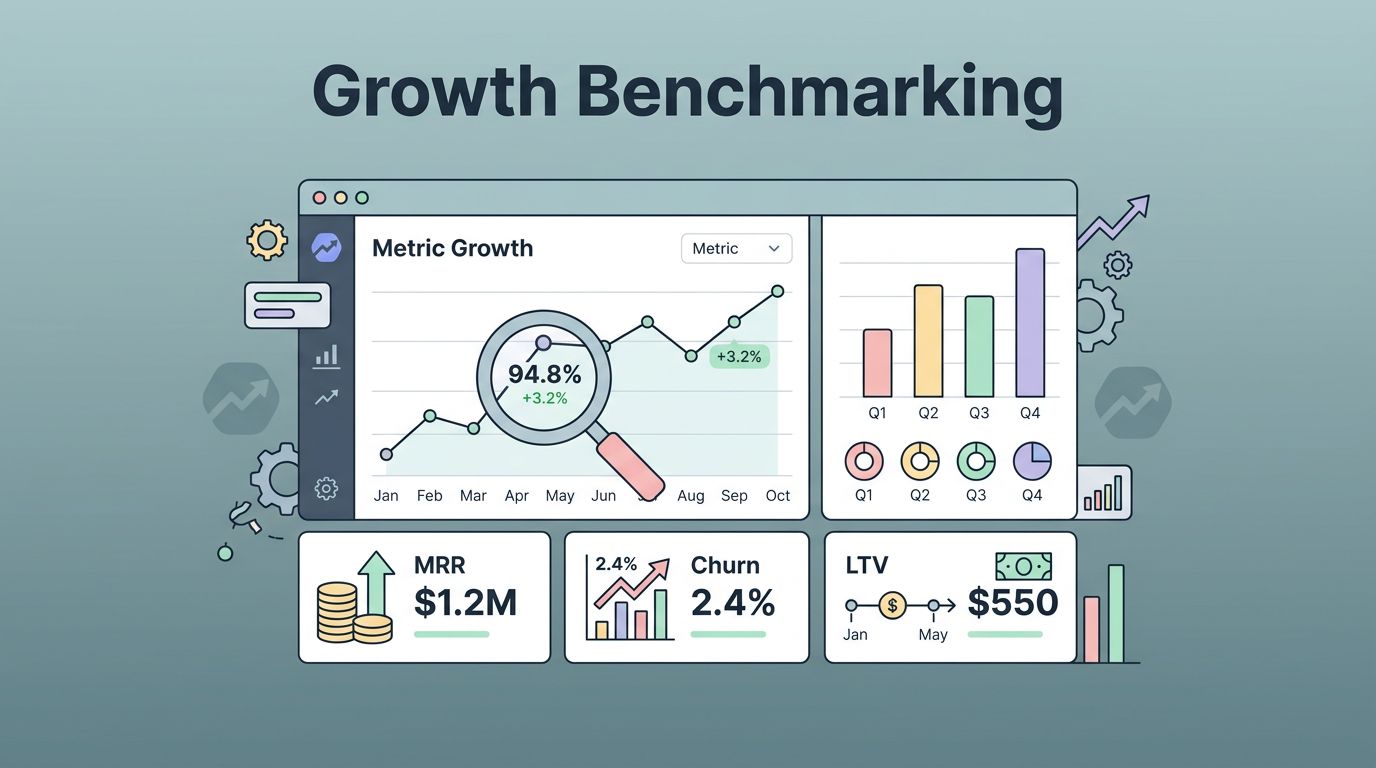
I also read the data in quarters, not as a single number. The median tells me what is common. The upper quartile tells me what good looks like. The lower quartile tells me where weak performance starts to show up.
When I use the numbers this way, I can answer one practical question fast: am I normal, above average, or falling behind?
For a plain-English refresher on the core SaaS metrics, I keep Paddle’s SaaS metrics guide close by. It helps me stay clear on what each number is actually measuring before I compare it to a benchmark.
Read the metrics as a system
I do not benchmark one metric in isolation. I read the whole set together, because the business rarely breaks in one place.
Baremetrics Benchmarks tracks MRR, LTV, user churn, revenue churn, active customers, quick ratio, failed charges amount, and failed charges percentage. I also keep the key Baremetrics metrics I watch in one place so I can review them fast.
Here is the way I read the main signals:
| Metric | If I am above the benchmark | If I am below the benchmark | What I do next |
|---|---|---|---|
| MRR | Revenue growth is healthy | Growth is trailing peers | Check acquisition quality, expansion, and pricing |
| LTV | Customers are worth more over time | Customers are not sticking long enough | Improve onboarding, retention, and upgrade paths |
| User churn | Retention is better than peers | Too many customers leave | Review activation, support, and cancellations |
| Revenue churn | Less recurring revenue is leaking | Revenue loss is too high | Fix downgrades, cancellations, and failed renewals |
| Active customers | Demand and conversion are strong | Funnel or activation is weak | Inspect trial flow, sales handoff, and onboarding |
| Quick ratio | New growth is beating losses | Churn is eating gains | Stop buying more traffic until retention improves |
| Failed charges amount | Billing recovery is weak | Payment recovery is healthy | Tighten retries and card update reminders |
| Failed charges percentage | More revenue is slipping away after sale | Billing flow is holding up | Review dunning emails and payment settings |
The pattern is simple. Growth metrics are better when they run above benchmark. Leakage metrics are better when they run below benchmark.
Baremetrics also helps me spot which weak metric is dragging everything else down. If churn is high, MRR rarely looks strong for long. If failed charges are rising, I know revenue is leaking after the sale, which makes every acquisition dollar work harder.
Turn benchmark gaps into decisions
I use benchmark gaps to pick the next move, not to fill a slide deck.
If churn sits above the benchmark, I start with onboarding, customer fit, and support. I look at the first 30 days of customer behavior. I also read cancellation reasons and watch where users stall before value.
If MRR sits below the benchmark while churn looks fine, I look at acquisition quality and expansion. That usually means my top-of-funnel traffic is weak, my trial-to-paid flow is soft, or my upgrade path is too hidden.
If LTV is low, I check whether customers are using the product deeply enough to stay. I also look for pricing plans that are too flat, because a one-size-fits-all package can cap account growth.
If failed charges are high, I focus on payment recovery before I touch marketing spend. A few small fixes can matter a lot here:
- I tighten retry timing.
- I send card update reminders faster.
- I check whether failed-payment emails are too easy to miss.
- I review whether annual and monthly plan flows create avoidable billing friction.
Those changes can recover revenue without adding new acquisition cost. That matters when growth is already expensive.
Use Pricing Insights to test price, package, and plan mix
Baremetrics is most useful when I stop treating price as a guess. Its Pricing Insights shows pricing patterns in the dataset and breaks down monthly and annual plans, so I can see whether my pricing sits in a sensible range.
I use that view when my benchmark data looks off. If my churn is healthy but MRR lags, my price may be too soft. If my price is higher than peers and conversion is weak, my offer may need clearer value, better packaging, or a simpler plan ladder.
I cross-check that thinking with OpenView’s metrics and benchmarks guide when I want a second view on what strong SaaS metrics usually look like. It gives useful context when I am deciding whether a pricing change should touch the monthly plan, the annual discount, or the feature split.
I do not use pricing benchmarks to copy the market. I use them to find friction. A pricing gap can point to underpricing, but it can also point to poor packaging or weak product value.
Build a review cadence I can repeat
A benchmark only helps if I keep looking at it. I make the review cadence part of the job, not a side task.
I keep the process tight:
- I capture MRR, churn, LTV, active customers, and failed charges.
- I compare each number with the Baremetrics benchmark quartiles.
- I pick the single gap that hurts revenue most.
- I choose one fix and assign it to a person or team.
- I check the same metric again after the next review cycle.
That rhythm keeps the work focused. It also stops me from treating every low number like an emergency.
Once a metric moves in the right direction, I move on to the next one. That is how the dashboard turns into a decision system instead of a wall of graphs.
Conclusion
Baremetrics makes saas growth benchmarking practical because it shows where my numbers sit beside similar companies. It gives me a clean reference point, then lets me choose the fix with the most impact.
I get the best results when I read metrics together. MRR, churn, LTV, and failed payments tell one story, and pricing fills in the rest.
The real win is simple. I stop asking whether the business feels healthy, and I start seeing exactly where growth needs work.