You’ve just closed a funding round. Cash flows in. But three months later, the runway shrinks faster than expected. Why? Your SaaS unit economics reveal the truth. Each customer costs more to acquire than they deliver in value.
I see this often as a revenue operator. Founders chase top-line growth. They ignore the per-customer math. Baremetrics changes that. It pulls data from Stripe or Chargebee. Then it shows MRR trends, churn spikes, and LTV gaps in real time.
In this post, I walk you through my process. We start with core metrics. Then we build to forecasts. You get actionable steps to fix weak spots.
Core Metrics That Drive SaaS Unit Economics
SaaS unit economics boil down to value in versus value out per customer. Revenue metrics like MRR set the base. Costs like CAC test sustainability.
MRR tracks monthly recurring revenue. It splits into new, expansion, contraction, and churned. I check this first. If expansion MRR dominates, customers stick and upgrade. Contraction signals pricing leaks.
ARPU follows. It’s average revenue per user. Baremetrics segments it by plan or geography. Low ARPU in enterprise tiers? Time to raise prices there.
Churn rate measures losses. Customer churn counts logos lost. Revenue churn tracks dollars gone. Aim for under 5% monthly in 2026. High numbers kill LTV.


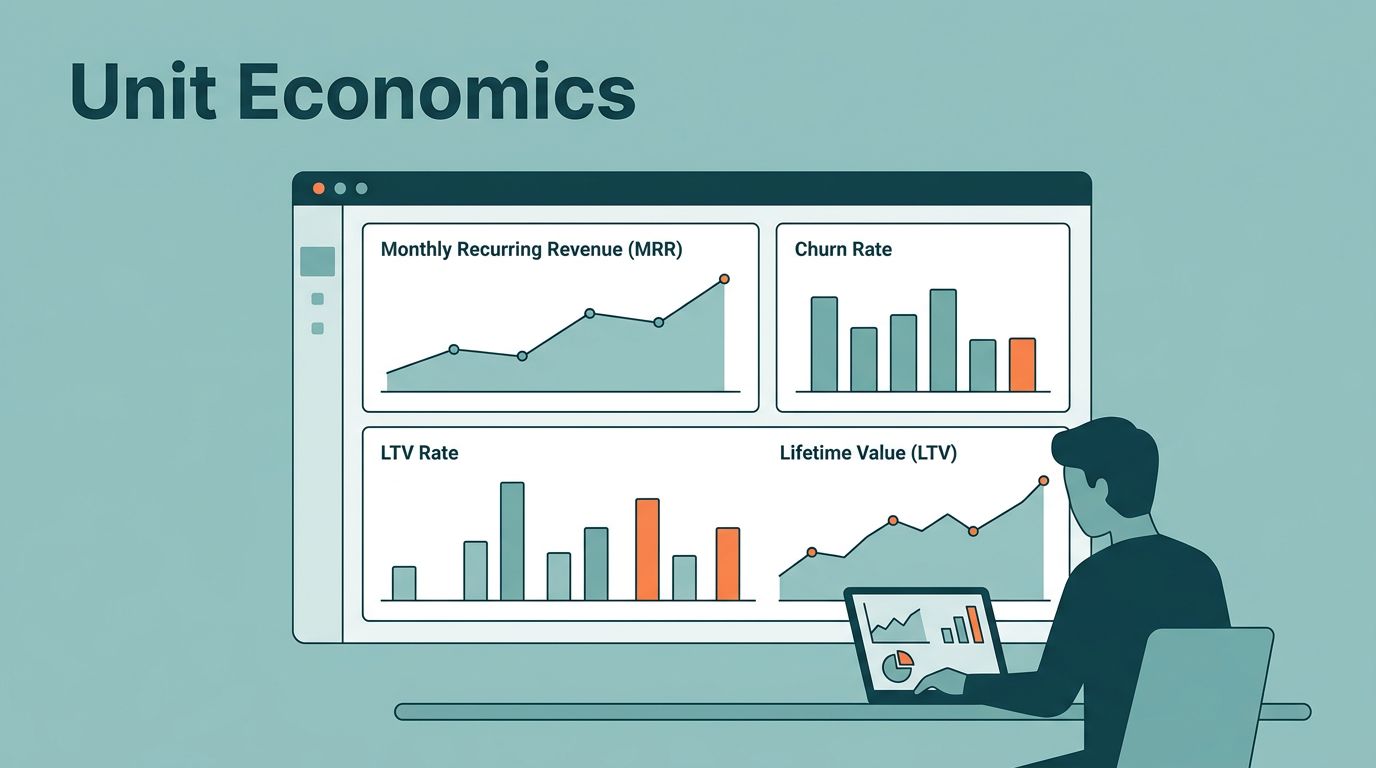
This dashboard view in Baremetrics pulls it together. Revenue lines climb. Churn pies highlight risks. LTV bars compare segments. CAC timelines flag slow paybacks.
LTV, or lifetime value, multiplies ARPU by customer lifespan. Baremetrics calculates it automatically. For details on their formula, check Baremetrics’ LTV guide. A healthy LTV tops three times CAC.
CAC covers acquisition costs: ads, sales reps, tools. Divide total spend by new customers. Baremetrics doesn’t compute it natively. I import from Google Ads or HubSpot. Then I ratio it to LTV.
Payback period divides CAC by gross margin times ARPU. Under 12 months works best. Longer? Cut CAC or boost margins.
NRR, net revenue retention, shows if existing customers grow revenue past 100%. Below 100% means shrinkage.
I review these weekly. Trends guide decisions. For my Baremetrics metrics against churn, I prioritize revenue churn over logo churn. Dollars matter more.
Connect Baremetrics and Pull Clean Data
Setup takes minutes. Link your payment processor. Baremetrics ingests events: signups, upgrades, dings.
Data cleans itself. It strips one-offs from MRR. Failed payments get dunned automatically. This adds 2-5% to revenue.
Smart Dashboards customize views. I build one for unit economics. MRR waterfall on top. LTV by cohort below. Alerts ping Slack on churn jumps.
Benchmarks compare you to peers. In 2026, top SaaS hits 3.5:1 LTV to CAC. Payback under 12 months. Gross margins over 70%.
Test integrations early. QuickBooks links handle expenses for full CAC. Xero works too.
Once live, data refreshes hourly. No spreadsheets. This frees me to analyze, not wrangle.
Break Down Metrics with Cohort Analysis
Single-month snapshots lie. Cohorts reveal patterns. Group customers by signup month. Track retention over time.
Baremetrics cohorts show ARPU curves. Early cohorts fade fast? Product fit issue. Later ones hold steady? Marketing improved.

Cohort charts like this expose truths. Bars drop for weak groups. ARPU lines climb for winners.
I segment further: by plan, channel, size. SMB cohorts churn at 8%. Enterprise at 3%. Focus sales there.
Example: My last SaaS client saw 6% overall churn. Cohorts showed pricing as the culprit. Basic plan users downgraded monthly. We hiked it 20%. Churn fell to 4%. LTV rose 25%.
Cancellation insights tag reasons. “Too expensive” clusters in low-ARPU groups. Fix with trials or bundles.
For cohort math, I reference SaaS Capital benchmarks. They match Baremetrics outputs.
This shifts decisions. Churn looks like product failure. Cohorts prove it’s pricing.
Compute LTV, CAC, and Payback in Practice
LTV starts with ARPU divided by churn. Baremetrics automates it per segment. I export to Sheets for CAC blend.
Scenario: ARPU $100. Churn 5%. LTV equals $2,000. CAC at $600. Ratio 3.3:1. Solid.
CAC climbs? Audit channels. Paid search CAC $800. Organic $400. Double down on organic.
Payback: CAC $600. Margin 80%. Monthly contribution $80. Payback 9.4 months. Green light.
High CAC relative to payback screams trouble. Spend outpaces recovery. I cut ads first.
Baremetrics pairs LTV with revenue churn analysis. Downgrades erode ARPU silently.
Segment level changes everything. One client averaged 2.5:1 LTV:CAC. Mid-market segment hit 4:1. Others dragged it down. We deprioritized small deals.
For precise CLV setups, see my Baremetrics customer lifetime value calculator guide.
Spot and Fix Unit Economics Red Flags
Churn spikes? Check failed payments first. Recovery tools grab 10-20% back.
NRR below 100%? Expansion lags. Push upsells via Baremetrics campaigns.
CAC payback over 18 months? Gross margins squeeze. Raise prices or trim sales headcount.
Example: Client MRR grew 20%. But LTV flatlined. Why? High-value users churned on support delays. Segment analysis pinned it. We hired reps. Payback dropped from 22 to 14 months.
Pricing hides issues. Use Baremetrics pricing metrics analysis to spot plan mix shifts.
Rule of 40 guides health: Growth rate plus profit margin over 40%. Baremetrics forecasts help hit it.
Test changes live. A/B pricing. Watch ARPU lift.
Forecast Unit Economics for 2026 Growth
Forecast+ builds scenarios. Base uses six months data. Upside assumes 2% churn drop. Downside factors seasonality.
It projects MRR, LTV, cash burn. Ties to hiring plans.

Forecast graphs project paths. Base lines steady. Optimistic curves climb on better LTV.
Link accounting for expenses. See full unit economics evolve.
Best practice: Run monthly. Adjust for trends. If downside shows negative cash in Q3, act now.
For full models, Baremetrics’ SaaS financial model template integrates seamlessly.
This turns data into runway extension.
Key Takeaways
Strong SaaS unit economics start with clean metrics in Baremetrics. Cohorts and segments uncover fixes. Forecasts secure the future.
Focus on 3:1 LTV to CAC. Payback under 12 months. These numbers build sustainable growth.
Run your own analysis today. Connect Baremetrics. Watch decisions sharpen.
(Word count: 1487)