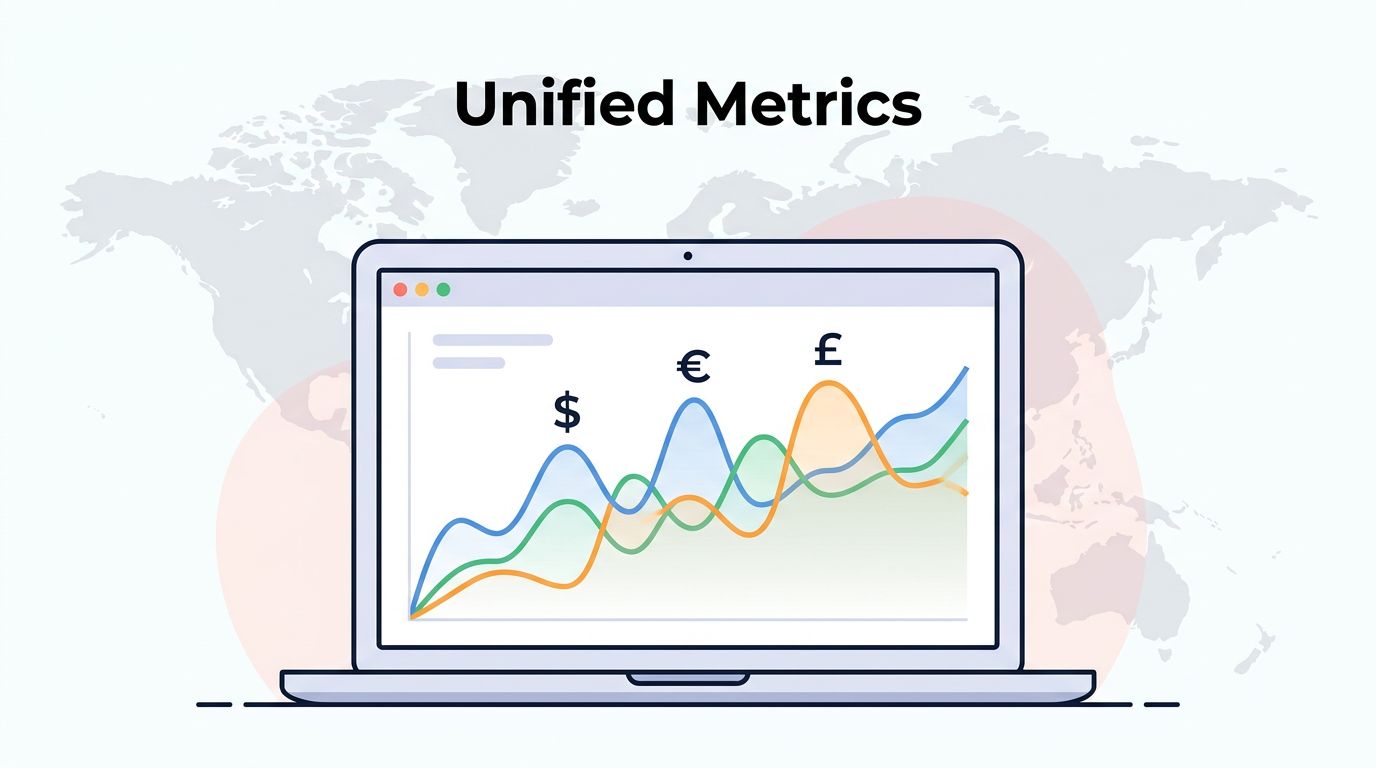
When my subscriptions span dollars, euros, and pounds, the revenue story can blur fast. One month looks strong in one market, weak in another, and the totals stop agreeing with each other.
I want one number set I can trust, especially when I share results with finance or the board. Baremetrics gives me that single view, so I can read MRR, ARR, and churn without translating every charge by hand.
Why multi-currency revenue gets messy fast
A subscription business looks simple until the invoices start crossing borders. A customer in London pays £99, one in Berlin pays €129, and another in Toronto pays C$149. Each charge is clear on its own, but the report gets noisy when I compare them side by side.
That noise shows up in several places. MRR can jump when exchange rates move. ARR can look stronger or weaker than the actual business trend. Churn can feel harder to pin down when one lost account carried more weight after conversion than it did on the invoice.
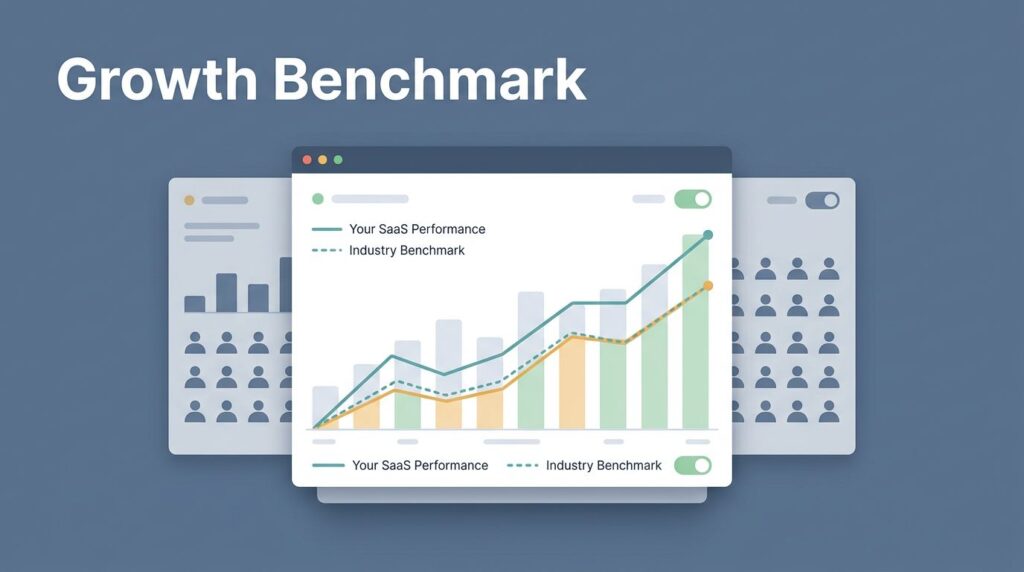
I also need consistency inside the team. Finance wants a clean reporting currency. Growth wants to see cohort movement. Founders want a number they can trust at a glance. That is why I keep building a SaaS metrics dashboard focused on the same currency view from the start.
The number I trust is the one that stays comparable month after month.
Once I lose that consistency, I spend time defending the report instead of reading it. That is the real cost.
How Baremetrics normalizes currency data
Baremetrics handles multi-currency by converting transactions into one main currency for my Stripe account. When I connect Stripe, it detects the default currency and builds the report from there. I do not need to clean up invoices or stitch together exchange-rate notes in a spreadsheet.
That matters because Baremetrics uses the exchange rate at the time of each transaction. It does not flatten every payment into one fixed rate. As a result, the metrics reflect the value of the subscription when the charge happened, which keeps the monthly story more honest. Baremetrics explains the setup in its multi-currency support note.
Here is how that feels in practice:
| Customer | Local charge | Reporting result |
|---|---|---|
| London account | £99 | Converted into my reporting currency |
| Berlin account | €129 | Converted into my reporting currency |
| Toronto account | C$149 | Converted into my reporting currency |
The value is not the table itself. The value is what happens next. My reports stop looking like a pile of separate markets and start looking like one business.

I also like that this view stays readable for non-finance stakeholders. A founder can scan it. A finance lead can audit it. A growth manager can use it without asking for a translation of every currency line.
The metrics I watch once the numbers are clean
Once Baremetrics has normalized the revenue, I focus on the measures that tell me whether the business is growing in a healthy way. Baremetrics has a helpful breakdown of 11 SaaS metrics that drive growth, and I return to that kind of list when I want to keep my reports grounded.
The first metrics I check are:
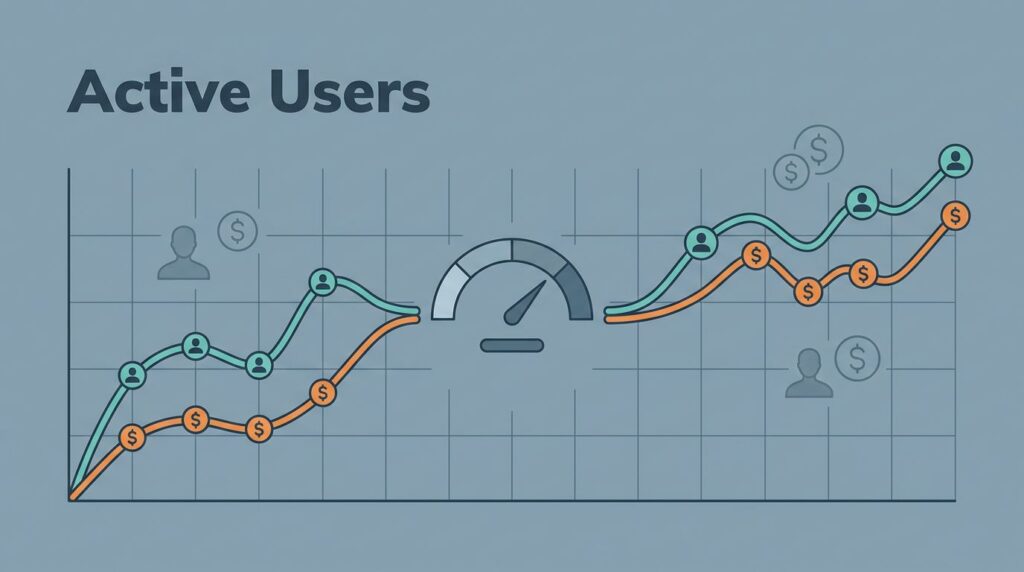
- MRR because it shows the monthly revenue story in one view.
- ARR because it helps me plan beyond the current billing cycle.
- Churn because lost revenue is easier to fix when I see it early.
- Expansion revenue because upgrades often hide inside the strongest accounts.
- Failed charges because billing friction can look like retention trouble.
I keep how to monitor churn and MRR close by when I review these numbers. The reason is simple. MRR and churn tell me where the business is leaking. Expansion tells me where it is gaining strength. Failed payments tell me where money gets stuck before it arrives.
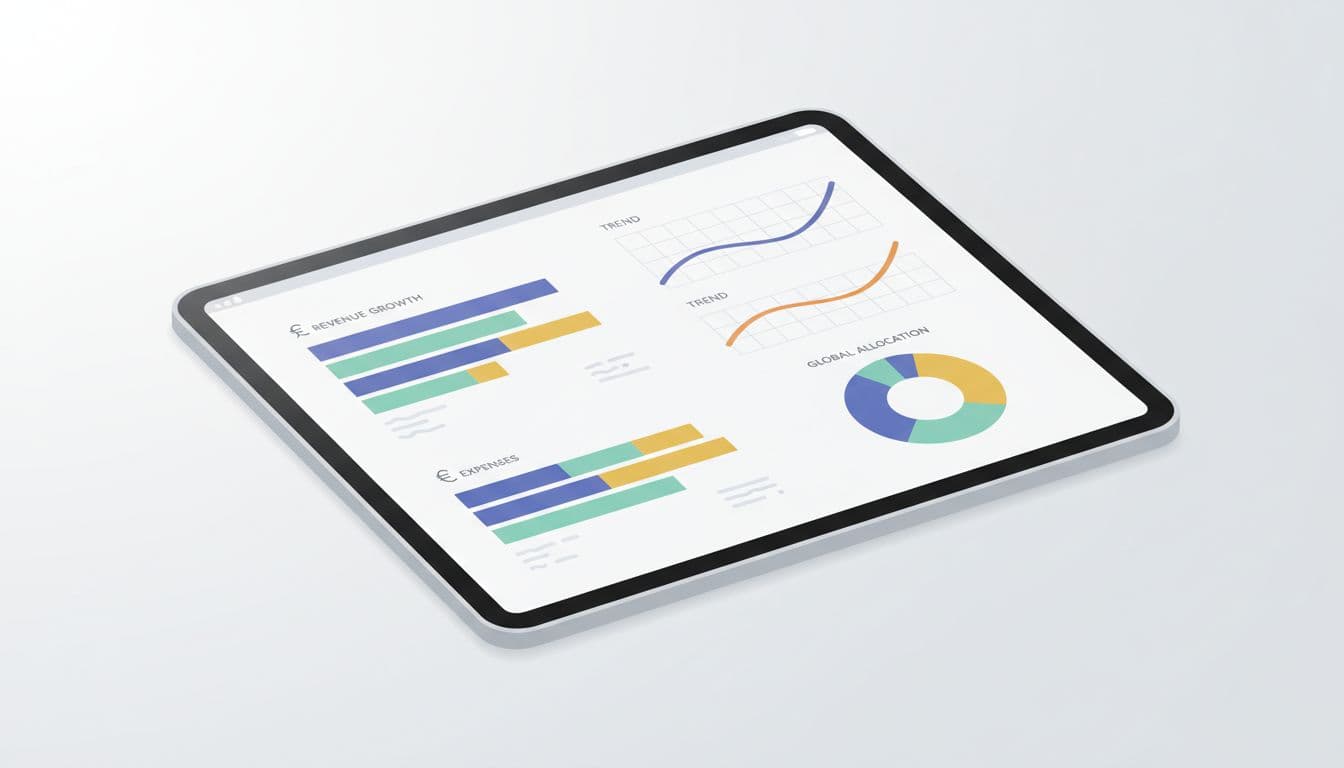
I pay attention to the gap between local market performance and reporting currency performance too. Sometimes a region grows well, but exchange-rate movement makes the top line look flatter than it should. Other times, a market looks steady while actual customer value is slipping. Baremetrics gives me the lens to spot both.
For international SaaS businesses, that clarity helps with pricing, expansion planning, and board updates. I can point to real subscription movement instead of arguing with currency drift.
How I use the report with finance and growth teams
I get the best results when I treat the Baremetrics view as the shared source for recurring revenue. Then I layer team-specific decisions on top of it.
Finance uses it to close the month faster and explain changes in MRR or ARR with less back-and-forth. Growth uses it to compare markets and see which region is adding more expansion revenue. Founders use it to answer the question that comes up in every review meeting: are we growing because customers stay longer, or because the currency table made one market look better than it is?
That is also where the broader stack matters. If I need to compare Baremetrics with the rest of my reporting workflow, I use evaluating Baremetrics for finance as a reference point. It helps me keep the subscription layer tight without losing sight of other reporting needs.
A simple monthly routine works well for me:
- Check the reporting currency first.
- Review MRR, ARR, churn, and expansion together.
- Scan market-by-market movements for unusual jumps.
- Compare failed payments with retention changes.
- Add notes for any pricing or FX changes before I share the report.
That routine keeps my numbers from turning into a mystery novel. I know what changed, where it changed, and why it changed.
Conclusion
Multi-currency billing does not need to make SaaS reporting messy. When Baremetrics converts transactions into one reporting currency and builds the metrics from there, I get a cleaner view of the business.
That cleaner view matters because I can trust the month-over-month trend, explain it faster, and make better calls on pricing, retention, and expansion. For me, that is the real win, a single revenue picture that holds together even when customers pay in different currencies.