An outage can begin with one failed connection and remain invisible until a customer reports it.
That delay is expensive. Network status monitoring on Twin.so gives your team a continuous view of reachability, latency, and failures before a small fault becomes a service incident.
Monitoring alone isn’t enough. You also need clear alert rules, assigned owners, and a public message that tells customers what is affected. Set up the checks first, then connect them to an incident process your team can run at 2 a.m.
What Network Status Monitoring on Twin.so Should Cover
Network monitoring and a public status page answer different questions. The first is for detection. The second is for communication.
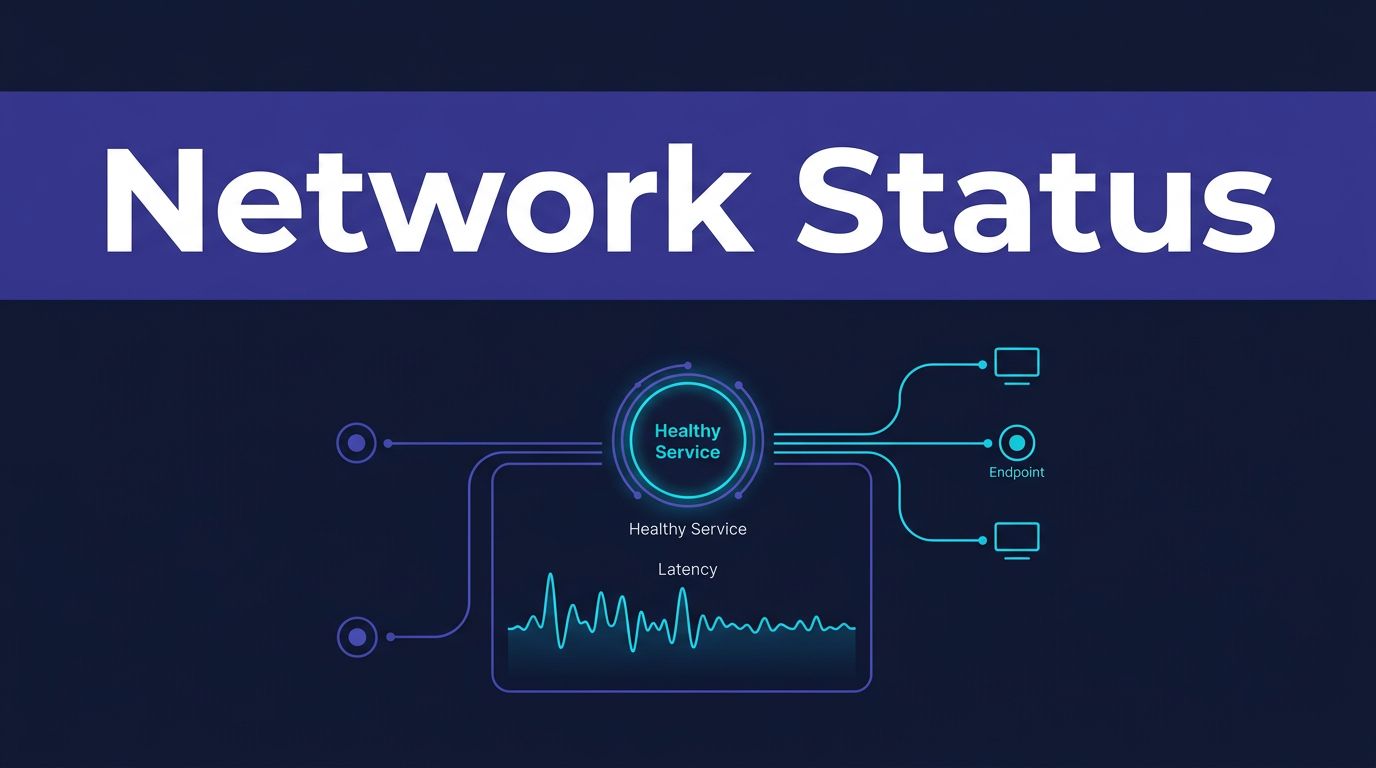
An internal monitor checks whether a target responds within an acceptable time. Depending on the target, that might mean checking an HTTP endpoint, DNS record, public IP, VPN gateway, or API. It can also track response codes and latency, not only whether a connection exists.
A public status page shows customers what your team already knows. It should explain the affected service, current impact, incident state, and the next update time. It shouldn’t expose internal IP addresses, firewall details, or unverified technical theories.
Keep both systems connected, but don’t treat them as the same tool. A monitor can detect a failure without publishing anything. A status page can say “operational” while a monitor is failing if the two workflows aren’t linked.

A monitor detects the problem. A status page controls how customers experience the response.
Current uptime monitoring software comparisons often group checks, on-call routing, and status pages together. Evaluate each function separately before you decide how Twin.so fits into your monitoring stack.
Build a Useful Monitor in Twin.so
Don’t start by adding every device and endpoint. Start with the network paths that affect revenue, access, or customer service.
List the targets your team must know about immediately:
- The main customer-facing application and login endpoint.
- Public APIs used by customers, partners, or internal automation.
- DNS records, VPN gateways, and remote access services.
- Payment, authentication, email, or storage dependencies.
- Critical public IP addresses and network entry points.
Use Twin.so to create a separate monitor for each meaningful target. A single check for your homepage won’t tell you whether authentication, checkout, or an API integration has failed.
Constant monitoring doesn’t mean collecting every packet. It means running repeatable checks at a defined interval and recording the result. Shorter intervals make sense for customer-facing services. Less sensitive endpoints can use a wider interval to reduce noise and unnecessary requests.
Configure the check type around the failure you need to detect. An HTTP check can verify response codes and application availability. A DNS check can identify resolution problems. An IP or connection check can show whether a host is reachable, but it won’t prove that the application behind it works.
Build the first monitor with these steps:
- Give the monitor a clear name that includes the service and environment, such as “Production API” or “Remote VPN Gateway.”
- Add the correct URL, hostname, IP address, or endpoint and confirm that the check reaches the intended system.
- Set a timeout and failure threshold that match the service. A sample policy might alert after three failed checks or repeated responses above five seconds.
- Assign an owner, escalation contact, and service category before you activate the monitor.
Use tags or groups for production, staging, customer-facing, and internal systems. This makes filtering easier when several checks fail at once.
For every target, document the expected result. Write down the normal response code, normal latency range, maintenance schedule, and team responsible for recovery. This information turns a raw alert into an actionable event.
Configure Proactive Alerting Without Creating Noise
A monitor that records failures but sends no useful alert is a dashboard, not an operating system. Twin.so should notify the right person when a failure meets your defined threshold.
Start with three alert states:
- A warning identifies rising latency, intermittent failures, or a condition that needs review.
- A critical alert identifies a confirmed outage or failed dependency that needs immediate action.
- A recovery alert confirms that the target is responding again and closes the incident loop.

Route alerts according to impact. A production authentication failure may need an on-call notification and a team channel message. A staging latency warning may only need email or a ticket. Use the notification options available in your Twin.so workspace, but avoid sending every event to every person.
Each alert should contain enough context for the first response:
- Monitor name and affected service.
- Time of the first failed check.
- Failure reason, such as timeout, DNS error, or unexpected response code.
- Last successful check.
- Current severity and assigned owner.
- Link to the incident record or runbook.
Three failed checks is often a better starting point than paging after one timeout. Internet routes and third-party services can produce brief errors. A consecutive-failure rule reduces false alarms while still catching sustained outages.
Don’t hide intermittent failures by using a high threshold. Track them as warnings and review the pattern. A service that fails once every hour may pass an availability check while still damaging user sessions.
Add maintenance windows before planned changes. Otherwise, a firewall update, DNS migration, or server restart can produce alerts that nobody needs to investigate. Test the recovery notification as well. The response is incomplete if the team hears about the failure but never receives confirmation that service has returned.
A practical sample policy looks like this:
- Production API: check every minute, alert after three failures, notify the on-call team.
- Customer portal: alert on failed response codes or latency above the agreed limit.
- Staging environment: send warnings to the engineering channel without paging.
- VPN gateway: alert the infrastructure owner and include the current runbook.
Adjust those values after reviewing actual traffic and incident history. The right rule is the one your team can trust during a real event.
Use Twin.so Status Updates for Incident Communication
Detection happens inside the monitoring workflow. Customer communication needs a separate decision.
If your Twin.so setup includes a public status page, publish only confirmed information. Identify the affected component and describe the user impact in plain language. Avoid copying internal alert text directly to customers.
Use a consistent incident flow:
- Mark the incident as investigating when the failure is confirmed but the cause is unknown.
- Move to identified when the team understands the cause or has isolated the affected system.
- Use monitoring when a fix is in place and the team is checking recovery.
- Mark the incident resolved only after the relevant checks return to normal.
A useful first update is short:
We are investigating elevated API errors affecting new requests. The team is checking the production API and will provide the next update in 30 minutes.
That message tells customers what is wrong without promising a fix you don’t have. The next update should include what changed, whether the impact is smaller, and when customers can expect another update.
Don’t wait for a complete root-cause analysis before acknowledging a confirmed outage. Customers need an accurate first message more than they need an internal explanation.
The status page also needs an owner. Assign responsibility for publishing updates during business hours and after hours. A technically accurate monitor won’t help customers if nobody updates the communication channel.
Review Network Status Monitoring and Remove Blind Spots
Network status monitoring produces useful data only when someone reviews it. Set a fixed review cycle instead of opening the dashboard only after an outage.
Check these items each week:
- Repeated latency warnings that never reached the critical threshold.
- Monitors that have no current owner or escalation path.
- Alerts that were acknowledged late or sent to the wrong channel.
- Failures tied to deployments, firewall changes, DNS updates, or provider incidents.
- Targets that are monitored from one location but serve users in several regions.
A single external check proves that one path worked at one moment. It doesn’t prove that every office, ISP, region, or customer connection is healthy. Add checks that match your actual service geography and access model.
Track availability, latency, alert acknowledgement time, and time to recovery. Use the data to adjust thresholds and improve runbooks. Don’t focus only on a percentage such as 99.9% uptime. A short outage during a high-volume period may matter more than several minor failures overnight.
Review the monitor list after every major architecture change. Remove retired endpoints. Add new dependencies. Update owners when teams change.
Common setup mistakes are easy to avoid:
- Monitoring only the homepage instead of the critical user journey.
- Paging on one failed probe without a confirmation rule.
- Sending all alerts to a shared inbox.
- Publishing vague status messages with no next update time.
- Leaving maintenance windows and recovery notifications untested.
If your team needs help mapping services, owners, and alert routes before rollout, you can Book A Call to review the implementation plan.
Keep Network Monitoring Operational
A reliable Twin.so setup starts with a focused monitor list. Check the endpoints that matter, define failure thresholds, route alerts to named owners, and keep customer updates separate from internal diagnostics.
The strongest network status monitoring process does more than report downtime. It shortens detection, reduces alert confusion, and gives customers a clear answer while the technical team works. That is how a failed connection becomes a controlled incident instead of a surprise.