Ever wonder where your listeners tune in from around the world? I did too when I launched my podcast. Global podcast rankings sound glamorous, but chasing chart positions can distract from real growth. Transistor.fm gives me solid data on listener locations and downloads instead. You get a clear picture of international reach without the hype.
This guide walks you through my exact steps. I pull analytics weekly to spot trends. Let’s start with access.
Navigating to Analytics in Transistor.fm
Log into your Transistor.fm dashboard first. Click “Podcasts” in the left sidebar. Select your show from the list.
Next, hit the “Analytics” tab at the top. It loads fast, even on slower connections. I do this every Monday morning with coffee in hand.
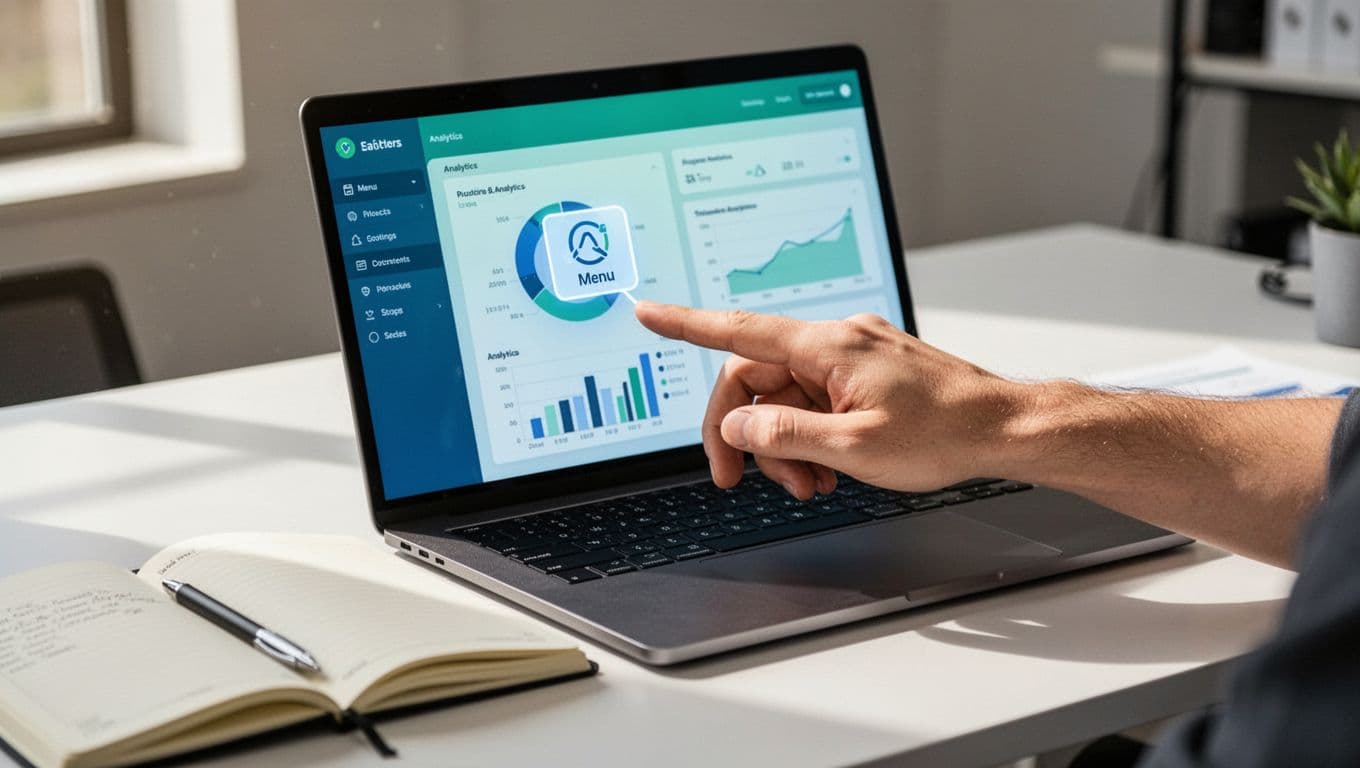
The page shows trends right away. Scroll down for details. Export data as CSV if you need spreadsheets. Transistor updated this in recent years for easier exports, as noted on their podcast analytics changelog.
Pro tip: Pin your top show. It saves clicks during busy weeks.
Decoding Global Listener Data
Transistor shines with its listener map. It lists countries by percentage of total downloads. The U.S. often tops my list at 60%. Canada follows at 10%, then the UK.
This isn’t a podcast global ranking like Apple charts. Those track top shows by plays in a country. Transistor measures your actual downloads from everywhere. For example, if Australia jumps to 5%, I know a promo worked there.
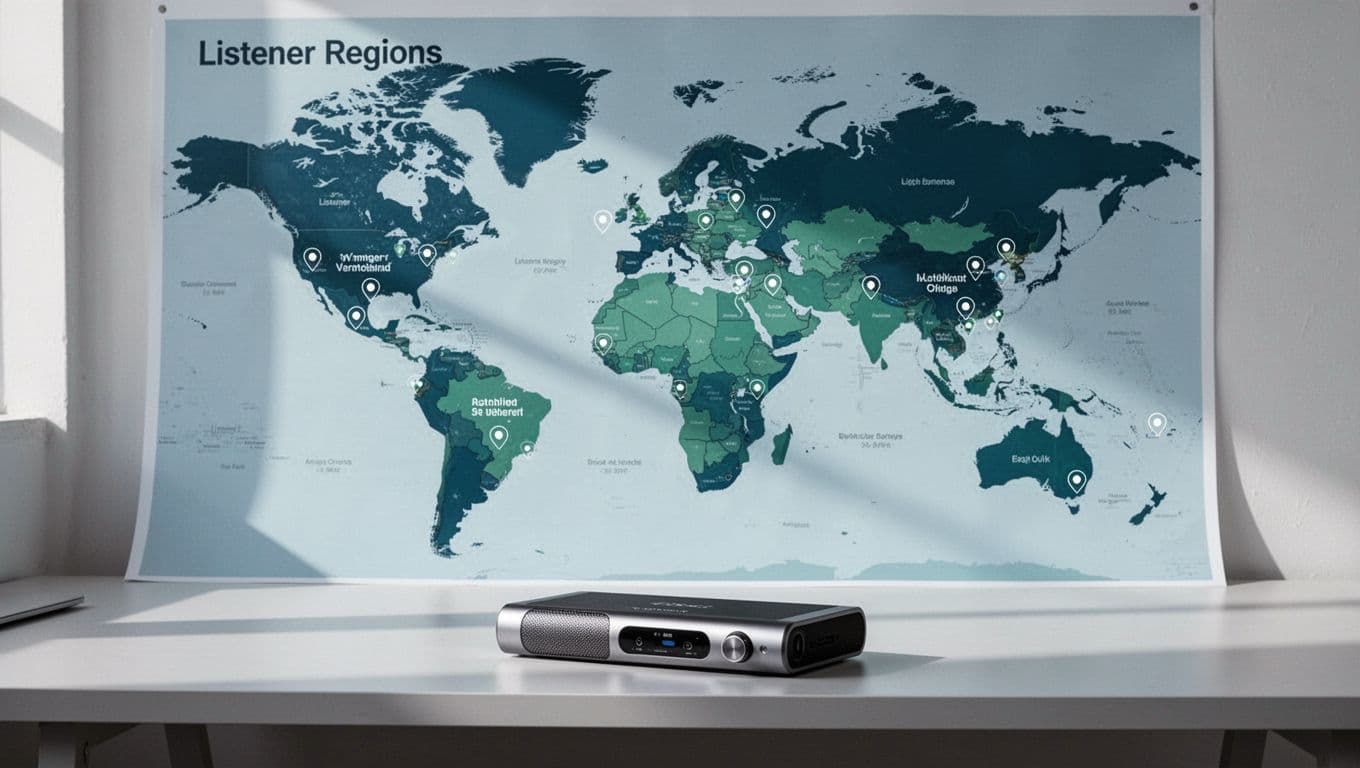
Click the map for state breakdowns in the U.S., Canada, or Australia. I spot clusters in Texas or Ontario. This helps tailor episodes, like more business tips for U.S. listeners.
In April 2026, their global stats page shows iOS apps lead worldwide. Android grows fast in Asia. Cross-check your data against that.
Core Metrics That Reveal Reach
Downloads per episode average over 30, 60, or 90 days. Mine average 500 after 60 days. Compare episodes side-by-side. The one on AI tools doubled others.
Estimated subscribers come from first-day downloads on recent shows. Trends graph by day, month, or year. I watch for plateaus; they signal stale topics.
Devices matter too. 70% of my plays hit iPhones. Smart speakers like Alexa add 5%. See top apps: Apple Podcasts dominates, Spotify close behind.

For deeper stats, visit Transistor’s podcast analytics overview. Filter by geography. Sort episodes by country performance.
Why Transistor Skips Chart Positions
Podcast global rankings mean spots on Apple or Spotify top charts. Transistor doesn’t track those. Platforms guard that data tightly. You check Apple Podcasts Connect or Spotify for Podcasters directly.
Transistor focuses on your downloads across all apps. It’s private and accurate. No estimates skewed by bots. For chart tracking, pair it with tools like Chartable. I export Transistor CSVs weekly, then upload there.
This combo gives full context. My show ranks #150 in U.S. business on Apple, but Transistor shows steady global growth.
Tips to Grow Your Global Audience
Promote in target countries. I shared clips on LinkedIn for Europe; downloads rose 15% there.
Time releases for time zones. U.S. mornings catch Asia evenings. Test with A/B episode titles.
In my Transistor Opus workflow, I clip episodes for YouTube Shorts. Global views feed back to podcast plays.
Analyze drop-offs. If U.K. listeners quit early, shorten intros. Retain more, climb indirect rankings.
Benchmark against averages. Transistor’s public stats help. Top shows hit thousands daily; aim there.
Troubleshooting Ranking Data Views
Can’t find analytics? Ensure Professional plan or higher. Starter limits exports. Upgrade if needed.
Numbers seem low? Downloads count after 24 hours. Streams from Spotify count too. Check trends over 90 days for truth.
No country data? Need 100+ downloads first. Build audience patiently.
Map blank? Refresh or contact support. I fixed mine by clearing cache.
FAQ: Does global rank update daily? No, listener data lags 48 hours. Charts? Use Apple/Spotify apps.
Wrapping Up Global Insights
Transistor.fm arms you with listener locations and download truths, not elusive chart spots. I rely on its map and trends to guide content. Growth follows real data.
Review weekly. Adjust promos. Watch countries expand. Your podcast reaches further each time.