I remember staring at spreadsheets full of candidate names and dates. Chaos ruled my agency’s hiring process. No clear picture of what worked or failed.
Recruitment KPI tracking changed that for me. Now, I spot bottlenecks fast and make decisions based on real data. Recruit CRM turns raw numbers into actionable insights.
You face the same rush. Clients demand quick fills, yet pipelines stall. Let’s see how I use this tool to monitor key metrics and improve outcomes.
Why Recruitment KPI Tracking Drives My Agency Forward
I run a staffing agency with tight deadlines. Without solid metrics, guesswork takes over. That’s why I track recruitment KPIs daily.
These numbers reveal truths. For example, a long time to hire signals screening issues. A low fill rate points to weak sourcing.
Recruit CRM fits my needs perfectly. Its dashboards pull data from pipelines and workflows. I get real-time views without manual exports.
In my staffing agency CRM switch to Recruit CRM, metrics jumped. Placements rose 25% in three months. Data guides every move now.
Focus on KPIs like these, and your team hires smarter. I prioritize ones tied to revenue and speed.
Essential Recruitment Metrics I Monitor Closely
I pick metrics that hit business goals. Time to hire tops my list. It measures days from job post to offer acceptance.
Time to fill follows. This tracks open roles from req to placement. Agencies aim under 40 days; I hit 32 last quarter.
Submission to interview ratio shows sourcing quality. I target 4:1. If it drops, I tweak job posts.
Interview to placement ratio matters too. Mine sits at 3:1. Recruit CRM breaks it down by job stage.
Fill rate gauges overall success. It’s placements divided by open roles. I push for 90% monthly.
Source performance ranks channels. LinkedIn leads for me at 45% of hires.
Recruiter productivity counts submissions per week. Top performers hit 50; laggards get coaching.
Pipeline conversion rates track stage drops. A 20% sourced-to-interview drop means fixes needed.
These metrics interconnect. For deeper lists, check Recruit CRM’s guide to 8 key recruitment KPIs. I log them weekly to spot trends.
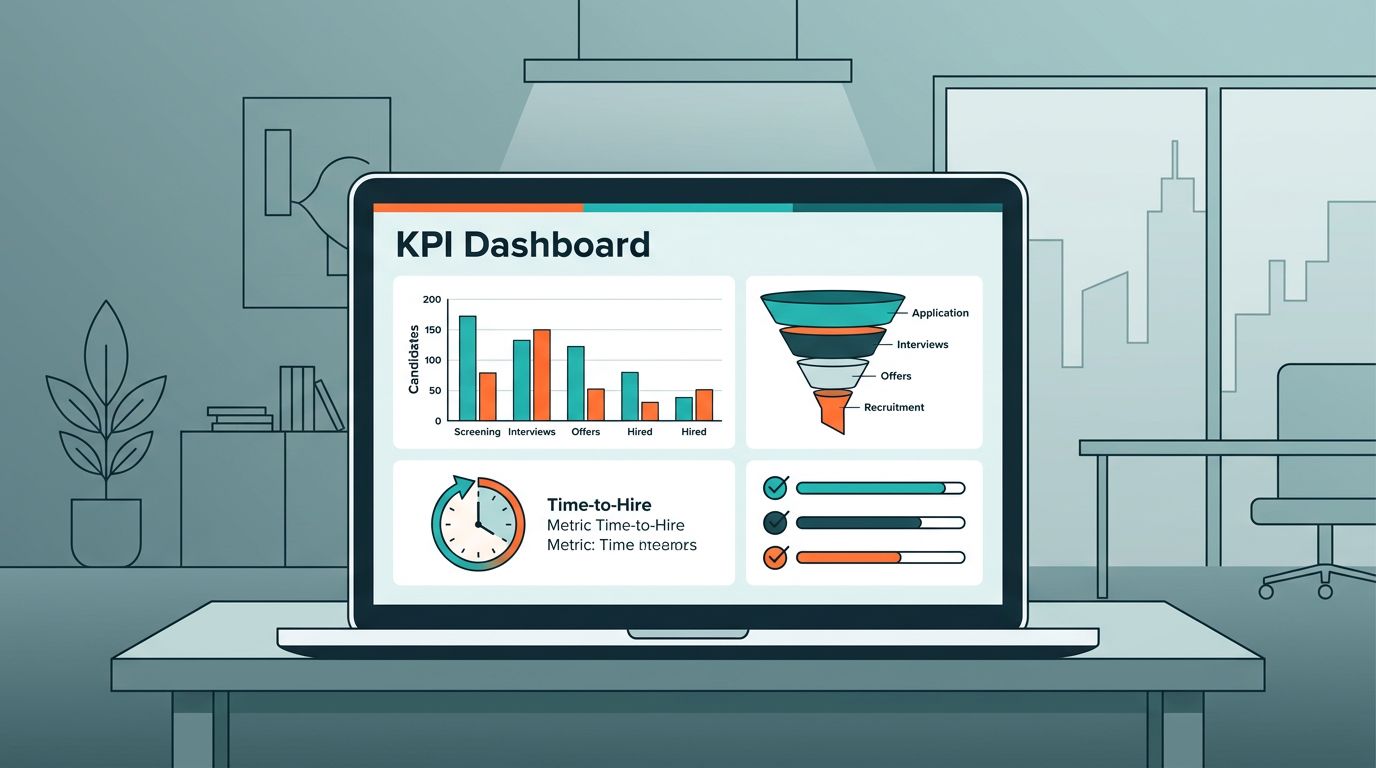
Visualizing KPIs in Recruit CRM Dashboards
Dashboards give me instant clarity. Recruit CRM’s customizable views show time to hire bars next to fill rate pies.
I log in each morning. One glance reveals pipeline health. Red flags pop for slow jobs.

This setup cut my review time by half. Team performance lines highlight stars and gaps. I assign mentors based on data.
Customize yours for focus. Add widgets for source performance or ratios. Real-time updates keep everyone aligned.
No more static sheets. Visuals make patterns obvious, like seasonal sourcing dips.
Custom Reports Reveal Hidden Bottlenecks
Reports dive deeper than dashboards. Recruit CRM offers 50+ types, per their latest updates.
Time to hire reports break stages. I see interviews lag two days on average. Adjust schedules fixed it.
Job statistics reports track fill rates per role. Tech jobs fill faster than sales for me.
details options like team performance. I export for client shares.
In my Recruit CRM setup for 30% more placements, reports proved the win. Productivity soared with per-recruiter breakdowns.
Generate weekly. Filter by date or team. Act on outliers, like a source with 10% conversion.
These tools turned data into dollars. One report spotted a bad channel; dropping it saved weeks.
Tracking Pipeline Conversion Rates for Smoother Flows
Pipelines visualize the journey. Recruit CRM’s Kanban boards show candidate cards moving stages.
I track sourced to interviewed drops. A 15% loss? Emails need punchier subjects.

Interview to placement ratios shine here. Boards flag stalled cards. Nudge clients directly.
Workflow data feeds conversions. Automated sequences boost ratios by 12% for me.
See Recruit CRM’s recruitment reports overview for stage metrics. Tweak boards to match your process.
This visibility cut ghosting. Hires flow faster now.
Measuring Source Performance and Recruiter Productivity
Sources vary. Recruit CRM tags them automatically. LinkedIn wins; I double efforts there.
Reports rank by conversions. Low performers get paused budgets.
Productivity ties to output. Dashboards show submissions and placements per recruiter.
Coaching follows data. One team member tripled fills after pipeline tweaks.
Integrate with 5,000 apps for full views. Email opens predict responses.
These metrics close loops. Strong sources and productive teams fill roles reliably.
Key Takeaways for Smarter Hiring
Recruitment KPI tracking with Recruit CRM sharpened my agency. Time to hire dropped 20%. Fills hit 92%.
Dashboards and reports make it simple. Focus on pipelines and productivity for quick wins.
Start small. Pick three metrics today. Watch decisions improve.
Your hires depend on data. I did it; you can too.