How I Measure SaaS Profit Margin in Baremetrics
A SaaS business can grow fast and still feel tighter every month. I have seen MRR climb while cloud bills, payment fees, and support load slowly squeeze the spread. That is why I use Baremetrics to read the revenue side first. It helps me s...
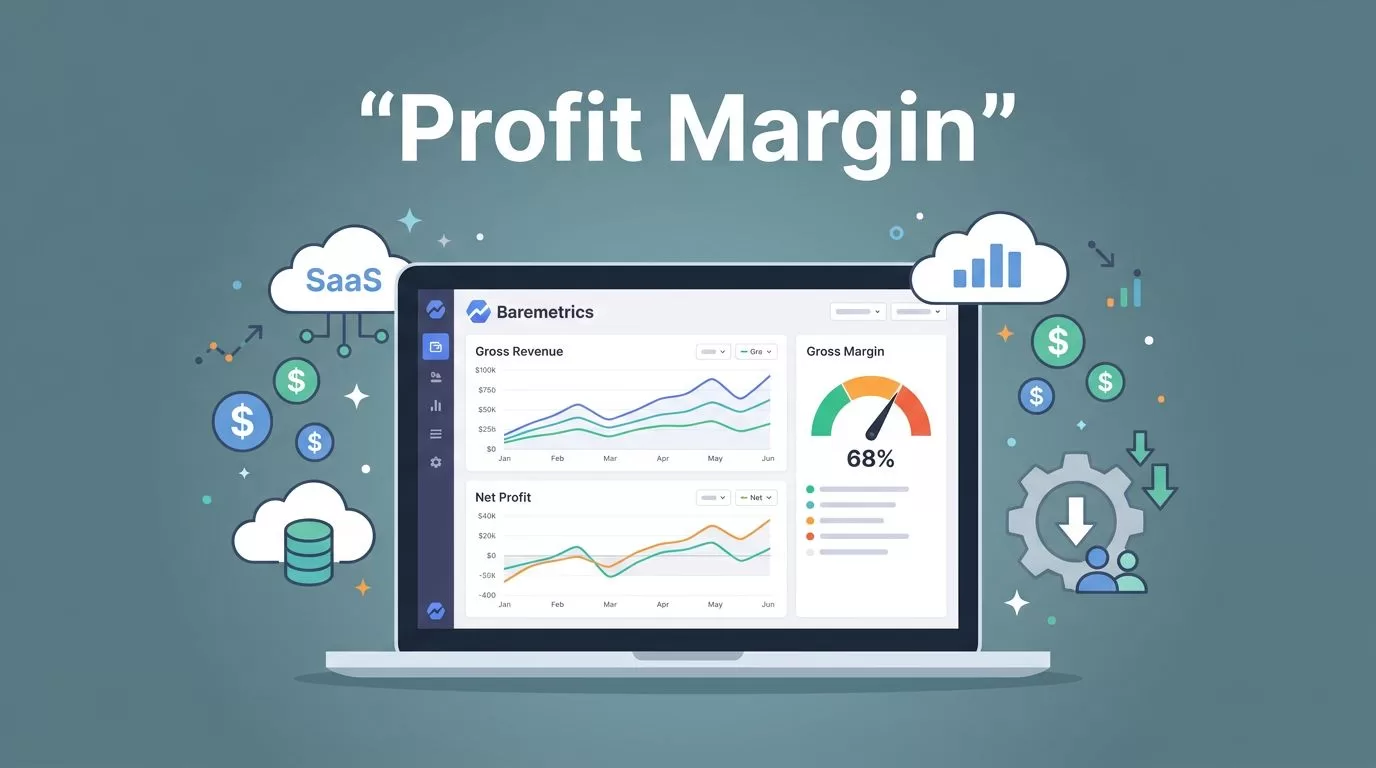
A SaaS business can grow fast and still feel tighter every month. I have seen MRR climb while cloud bills, payment fees, and support load slowly squeeze the spread.
That is why I use Baremetrics to read the revenue side first. It helps me spot margin pressure before the month closes, but I still need a simple formula and a clear way to interpret it.
Start with the margin Baremetrics can actually show
When people say “profit margin,” they often mean different things. In SaaS, I start with gross margin, because Baremetrics can help me measure the revenue and direct cost side with far more clarity than a spreadsheet full of guesswork.
Gross margin tells me how much revenue is left after direct service costs. Net profit margin goes further and includes payroll, marketing, rent, software overhead, and taxes. For most SaaS teams, those are different conversations.
A plain definition helps here. For a broader refresher, I keep Stripe’s explanation of SaaS gross margin handy when I want to check the math without the finance jargon.
| Margin type | Formula | What I use it for |
|---|---|---|
| Gross margin | (Revenue – direct costs) / Revenue x 100 | Checks whether the product is efficient |
| Net profit margin | Net income / Revenue x 100 | Checks the full business after all expenses |
That table is the key. Baremetrics helps me get the first number right, then I use accounting data for the second.
What I pull from Baremetrics before I calculate anything
I do not start with profit. I start with the revenue story.
Baremetrics gives me a clean view of MRR, churn, expansion, and segmentation, which is enough to see whether margin is improving or slipping. I also like its real-time dashboard, because a margin dip is easier to catch when the line moves today instead of next quarter.
When I want a tighter view of the metrics that matter most, I use tracking key SaaS metrics to protect revenue as my checklist. If I need a better layout for the team, I also use setting up a smarter Baremetrics dashboard to group the numbers by plan, region, or cohort.

Once I set up the view, I look for the signals that affect margin most:
- MRR shows whether the business is expanding or stalling.
- Churn shows how much revenue leaks out each month.
- Expansion revenue shows whether existing customers are paying more.
- Segmentation shows which plans, cohorts, or regions pull margin down.
- Forecasting helps me see whether today’s margin shape is likely to hold.
Baremetrics is strong here, but it is not a full accounting system. I use it to track revenue, churn, and gross margin signals. I do not use it to close the books.
I trust Baremetrics to show me where the revenue bends. I still trust accounting to tell me the final profit.
That split matters. If I blur it, I start making bad calls from clean-looking data.
My simple formula for SaaS profit margin
Once I have MRR and direct costs, the math stays simple.
Gross margin % = ((MRR – direct monthly costs) / MRR) x 100
If my direct costs are billed annually, I divide them by 12 first. That keeps the margin view monthly, which matches the way Baremetrics reports recurring revenue.
Here is a basic example.
| Item | Amount |
|---|---|
| MRR | $50,000 |
| Direct monthly costs | $9,500 |
| Gross profit | $40,500 |
| Gross margin | 81% |
In this example, I keep 81 cents of every revenue dollar after direct costs. That is a healthy number for many SaaS models, but context still matters. A data-heavy platform with high infrastructure usage may run lower than a lightweight self-serve app.
If I want another plain-language breakdown, The SaaS CFO’s gross margin guide is a good second reference.
The important part is what goes into direct costs. I include items tied to delivery, such as:
- hosting and infrastructure
- payment processing fees
- support tools tied to service delivery
- third-party APIs that power the product
- customer success work that scales with usage
I leave out sales, marketing, and general overhead. Those belong in net profit, not gross margin. If I mix them together, the number stops helping me.
How I read the number instead of worshipping it
A margin percentage is not useful by itself. I use it as a signal, then I compare it with growth and retention data.
If MRR is rising but margin is falling, I ask whether growth is expensive. Maybe a lower-priced plan uses too much support. Maybe one region has higher payment fees. Maybe a feature release increases usage costs faster than revenue.
If churn drops and margin improves at the same time, I breathe easier. That often means the product is sticking and the cost to serve is staying under control.
If expansion revenue rises but CAC rises too, I slow down. Strong retention can hide weak acquisition math. A business can look healthy in Baremetrics and still burn too much cash to buy growth.
This is why I keep SaaS profit margin beside the rest of the core metrics, not above them:
- MRR and expansion MRR tell me whether revenue growth is healthy.
- Churn and revenue churn tell me whether the base is holding.
- LTV tells me how much value a customer can create over time.
- CAC tells me what I spend to win that customer.
- Retention tells me whether the gains last long enough to matter.
When I need a broader view of how those metrics fit together, Baremetrics analytics for subscription revenue clarity helps me keep the limits in mind. I treat benchmarks as a reference point, not a verdict. My own trend line matters more than a generic average.
A quick way I review margin trends each month
I keep the review process simple so I will actually do it.
- I open Baremetrics and check the month-over-month MRR trend.
- I compare churn and expansion against the same period.
- I pull monthly direct costs from billing, cloud, and payment data.
- I calculate gross margin and compare it to the prior month.
- I segment by plan or cohort when the number moves the wrong way.
That review takes less time than a long finance meeting, and it gives me a cleaner read on the business.
The best part is the segmentation. A single margin number can hide a lot. One plan might look excellent while another loses money after support and usage costs. When I split the data, the weak spot stops hiding.
What Baremetrics won’t tell me on its own
Baremetrics gives me a strong view of subscription revenue health, but it does not replace my accounting stack. It does not settle the full profit question after payroll, tax, and overhead.
That limitation is useful, not annoying. It keeps me honest about what the tool is for.
Baremetrics is the lens I use to see the shape of margin. My finance system is the ledger that tells me the full story. When those two views agree, I trust the number. When they do not, I know where to look next.
Conclusion
When I measure SaaS profit margin in Baremetrics, I start with gross margin, not a vague idea of profit. That gives me a clean, monthly signal tied to MRR and direct service costs.
Then I read the margin alongside churn, retention, LTV, CAC, and expansion. That is where the real story lives. A business can grow and still lose efficiency, or it can hold a steady margin while the customer base gets stronger.
Baremetrics helps me see that pattern early. The number matters, but the trend matters more.
