I remember the day a single failed payment spike wiped out 2% of our MRR before lunch. No alert. No dashboard glance. Just a quiet revenue dip that snowballed into a tough board call. As a SaaS founder, you know these moments. Daily metrics catch them early.
Baremetrics changes that routine. It pulls live data from Stripe or Chargebee, so I see MRR shifts, churn signals, and trial conversions as they happen. No spreadsheets. No delays.
You get a clear view of your business pulse. Let’s walk through how I set it up and use it every day.
Why Check SaaS Metrics Every Day
Daily checks keep surprises small. Monthly reports hide problems. A churn wave builds over weeks, but Baremetrics daily metrics spot it on day three.
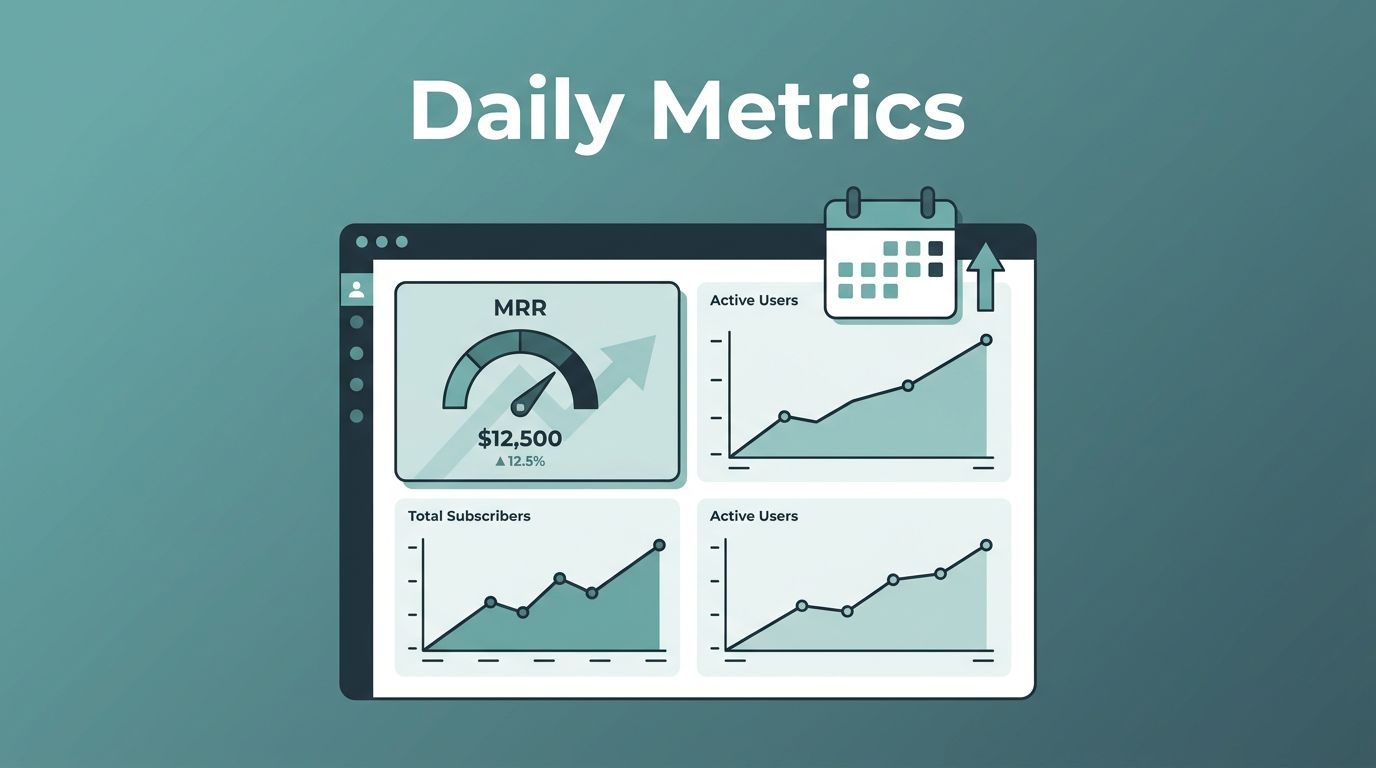
Think of your revenue like a river. Daily flows show rocks or dams before floods. I log in each morning. MRR holds steady? Good. ARPU dips? Check upgrades. This habit saved us $12K last quarter from early failed payment recoveries.
Teams win here too. Finance leads watch cash flow forecasts. Growth ops track trial conversions. Founders align on quick ratios above 1.2. Baremetrics benchmarks compare you to peers, so isolation ends.
Noise happens. Weekends bring low activity. But patterns emerge fast. I set Slack alerts for 5% MRR drops. No more blind spots.
In short, daily monitoring turns data into decisions. It protects growth before leaks grow.
Key Daily Metrics I Monitor
I focus on eight core numbers. They paint the full picture. Revenue first, then retention and acquisition.
MRR tops the list. It’s the monthly recurring revenue from active subs. Baremetrics breaks it into new, expansion, contraction, and churn. A flat MRR with rising new means churn eats gains.
ARR follows. It annualizes MRR for long-term views. Investors love it stable above $100K.
Churn splits two ways. Customer churn counts lost accounts. Revenue churn measures dollar loss. Both under 5% monthly? Healthy. Over? Dig into cohorts. For details on calculating SaaS churn rate in Baremetrics, check my guide.
ARPU shows average revenue per user. Drops signal downgrades. ARPA adds active accounts for precision.
LTV predicts total value per customer. I divide it by CAC for efficiency. Rising LTV means retention works.
Failed payments and recoveries matter most daily. They cause 5-15% involuntary churn. Baremetrics dunning recovers 30-70%. Track recovery rates beside churn.
Trials and conversions close the loop. Daily signups to paid ratios guide onboarding tweaks.

These metrics live in Baremetrics’ Control Center. See the full 28 tracked there, including NRR for net retention.
Setting Up Baremetrics for Real-Time Data
Connect once, watch forever. I link Stripe in minutes. Baremetrics backfills history. No manual imports.
Pick your plan. Launch at $75/month gives basics. Growth at $255 unlocks custom dashboards and segments. Start with the 14-day trial.
Enable alerts next. Slack pings for churn spikes or MRR drops. Email summaries hit inboxes weekly.
Cohort views activate under analytics. Group by signup month or plan. Watch retention curves daily.
For failed payments, turn on Recover. It retries cards automatically. Dashboards show impact on MRR.
Trials get their tab. Filter conversions by channel. Low 20% rates? Test emails.
I review Baremetrics MRR calculations weekly to verify accuracy. Failed charges don’t count as churn. Recoveries do boost it back.
Setup takes under an hour. Then data flows live.
Customizing Your Baremetrics Dashboard
Dashboards make daily checks fast. Drag metrics to the top row. I pin MRR, net new MRR, churn, and active customers.
Finance view adds ARPU and failed charges. Growth teams see trial conversions and expansion MRR. For building Baremetrics dashboards for SaaS, I start simple.
Use Smart Dashboards for auto-updates. Filter by plan or region. Annotations explain spikes, like “Q2 pricing test.”
Benchmarks sit beside. Compare your ARPU to industry averages. Below median? Price test.
Forecast+ projects 12 months out. It factors seasonality. Ties to QuickBooks for precision.


This setup fits my screen. Ten seconds per check. Trends jump out.
Spotting Trends Amid Daily Noise
Daily data wiggles. Weekday signups surge. Holidays quiet. Ignore noise, chase signals.
I overlay 7-day averages on charts. Smooth lines reveal uptrends. Baremetrics does this auto.
Churn example: Three cancels Tuesday? Normal. Five daily for a week? Cohort issue. Check early signups.
MRR volatility? Net breakdown helps. Expansion offsets contraction? Stable. Churn dominates? Act.
LTV trends over cohorts. Flat lines mean acquisition costs too much.
Failed payments spike Fridays? Card expirations. Recoveries lag? Tweak dunning emails.

Use Quick Ratio daily. Above 1? Growth mode. Below? Retention focus. For net revenue retention in Baremetrics, pair with NRR.
Patterns guide. Noise distracts.
Turning Daily Insights into Actions
Data alone sits idle. I act fast.
MRR dip? Review cancellations. Baremetrics surveys show reasons. Too pricey? Offer discounts.
Churn rises? Segment cohorts. First-90-day losses? Fix onboarding. See churn detection with Baremetrics dashboards.
ARPU falls? Check plan mixes. Push upgrades via emails.
Trials stall? A/B test landing pages. Conversions climb 15% last time.
Recoveries low? Test dunning sequences. One extra email doubled ours.
Share via Slack. Finance gets forecasts. Ops gets cohort alerts.
For payment recovery strategies, Baremetrics’ dunning guide details metrics like retry success.
Actions compound. Daily habits build revenue walls.
Conclusion
Daily Baremetrics checks turned our reactive scrambles into steady climbs. MRR stabilized. Churn halved. You spot leaks before they flood.
Pick three metrics first: MRR, churn, failed payments. Build from there. Your SaaS health improves fast.
What one change will you make tomorrow? Data waits for no one.
(Word count: 1,482)