I remember staring at spreadsheets scattered across my desk. Each one tracked a piece of our hiring puzzle: candidate responses, interview schedules, placement wins. But pulling it all together took hours every week. That’s when I built a recruitment metrics dashboard in Recruit CRM. It changed everything. Now, one glance shows our strengths and bottlenecks.
You face the same chaos if you run a recruiting agency or talent team. Data hides in emails and notes. Decisions feel like guesses. Recruit CRM fixes that with real-time views. I’ll walk you through my exact setup. Follow these steps, and you’ll spot trends faster, hold your team accountable, and forecast placements with confidence.
Why Build a Dashboard Now
Recruit CRM dashboards pull hiring data into clear charts. I started mine to answer simple questions. Which sources deliver the best candidates? Who’s closing deals fastest? Without this view, we chased shadows.
Agencies waste time on manual reports. A dashboard updates live as you add candidates or jobs. It flags drops in pipeline flow right away. For example, if submissions stall, you adjust outreach that day.
Team accountability jumps too. Recruiters see their numbers next to peers. Goals become targets, not wishes. In my agency, placements rose 28% after we shared the board weekly. Clients love the proof of quick fills.
Forecasting gets sharp. Spot patterns in time-to-fill, and predict busy seasons. No more surprises. Recruit CRM’s tools make this easy, even for non-tech users.
Key Metrics to Include
Pick metrics that match your goals. I focus on seven that drive results. They cover speed, quality, and output.
Time to fill tops my list. It counts days from job post to hire. Aim under 30 days. Long times signal sourcing issues.
Next, submission-to-interview ratio. Divide interviews by submissions. A 20% rate means strong screening. Low numbers? Refine your filters.
Placements track wins. Percent of candidates hired from your pool. Target 25% or higher.
Source performance shows what works. LinkedIn? Referrals? Bar charts rank them by conversions.
Recruiter productivity measures output. Placements per recruiter, calls made, emails sent.
Pipeline conversion rates reveal leaks. Funnel charts display applied to interviewed to offered.
Client KPIs round it out. Repeat business rate, fee per placement.


These numbers guide fixes. For deeper dives on key KPIs like time to fill, check my review of Recruit CRM as headhunter software.
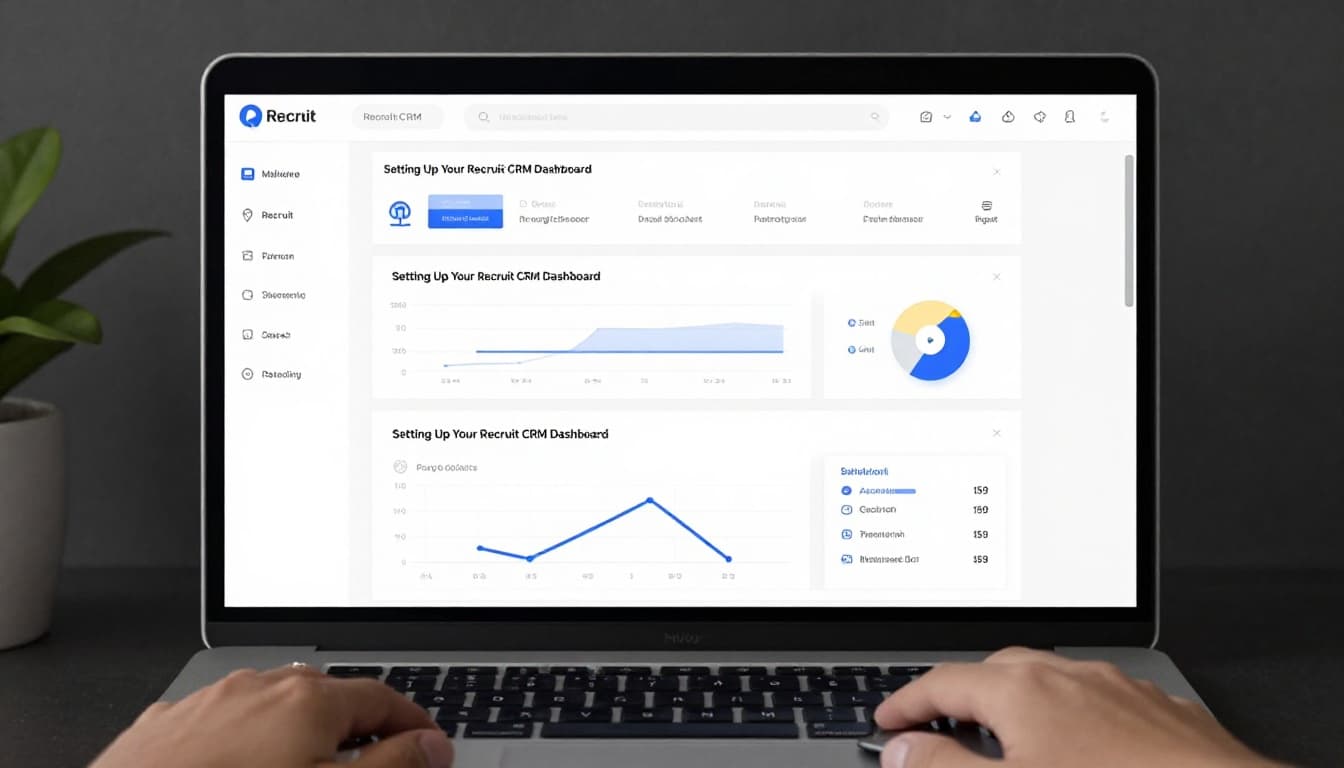
Setting Up Your Recruit CRM Dashboard
Log into Recruit CRM. Head straight to the dashboard page. It loads with default stats: open jobs, candidate stages, deal values.
Click customize. Drag widgets from the menu. Start with core reports.
Here’s my step-by-step:
- Gather data first. Ensure jobs, candidates, and placements have stages, sources, dates. Use auto-parse for resumes. Clean entries prevent bad charts.
- Select reports. Go to Reports tab. Choose Time to Hire, Team Performance, Job Statistics, Client reports. Recruit CRM’s help center lists them all.
- Add widgets. Drop KPI tiles for big numbers like placements. Add line graphs for trends. Funnel visuals for pipelines.
- Apply filters. Set date ranges, recruiters, or job types. Group by client for agency views.
- Set targets. Input goals like 30-day fills. Colors turn red on misses.
- Save and share. Name it “Agency Metrics.” Assign views to teams. Mobile access works anywhere.
Test it. Add a fake candidate. Watch numbers shift live. My first version took 20 minutes.
Customizing for Your Team
Tailor views per role. Owners see agency-wide KPIs. Recruiters get personal stats.
Add Big Screens for office TVs. It cycles metrics during standups.
Filters let you drill down. Click a low source? See candidate details.
As of April 2026, AI tweaks suggest widgets based on your data. Enable alerts for drops, like time-to-fill over 40 days.
Share exports as PDFs for clients. They see your efficiency without logins.
Interpreting Data to Drive Decisions
Data alone sits idle. Use it to act.
Low submission-to-interview? Train on better quals. Source performance charts showed my team over-relied on one board. We diversified, conversions climbed 15%.

Recruiter productivity gaps spark coaching. One lagged on calls; pairing fixed it.
Pipeline rates forecast loads. Slow stages mean more sourcing. Client KPIs predict renewals.
Weekly reviews keep momentum. We cut average fill by 12 days this way. For more on building recruitment dashboards, see Recruit CRM’s guide.
Conclusion
My Recruit CRM dashboard turned scattered data into clear paths. Time to fill dropped. Placements grew. Teams own their numbers now.
You can replicate this fast. Pick metrics, customize widgets, review weekly. Results follow.
Strong dashboards build better agencies. Start yours today.